Tạo bản đồ luồng giá trị: Tìm hiểu quy trình bằng cách sử dụng các công cụ
Hãy tưởng tượng bạn đang khiến hoạt động kinh doanh của mình trở nên trôi chảy hơn, cắt giảm các bước không cần thiết và hoàn thành mọi việc nhanh hơn. Bản đồ luồng giá trị (VSM) là một công cụ tiện dụng có thể giúp bạn thực hiện điều đó. Công cụ này cho phép bạn xem cách vật liệu, thông tin và công việc di chuyển qua các quy trình của bạn, hiển thị rõ ràng những gì đang diễn ra và chỉ ra nơi bạn có thể cải thiện mọi thứ. Hướng dẫn chi tiết này sẽ chỉ cho bạn cách tạo Bản đồ luồng giá trị (VSM). Chúng tôi sẽ nói về lý do tại sao VSM tuyệt vời, nơi bạn có thể sử dụng nó và những gì bạn cần để bắt đầu. Thêm vào đó, chúng tôi sẽ cung cấp cho bạn hướng dẫn sử dụng MindOnMap, Word và các công cụ VSM trực tuyến để tạo bản đồ của bạn. Hãy cùng tìm hiểu và đưa hoạt động kinh doanh của bạn lên hàng đầu và sẵn sàng đạt đến những tầm cao mới.

- Phần 1. Bản đồ luồng giá trị là gì
- Phần 2. Bản đồ luồng giá trị là gì? Những cách sử dụng phổ biến
- Phần 3. Cách tạo bản đồ luồng giá trị: Các bước
- Phần 4. Thành phần và Biểu tượng Bạn Có thể Sử dụng trong Ánh xạ Giá trị
- Phần 5. Cách đánh giá chất lượng của bản đồ luồng giá trị
- Phần 6. Các công cụ hữu ích để tạo bản đồ luồng giá trị
- Phần 7. Các câu hỏi thường gặp về Lập bản đồ luồng giá trị
Phần 1. Bản đồ luồng giá trị là gì
Value Stream Mapping là một phương pháp tuyệt vời từ quản lý tinh gọn giúp bạn cải thiện quy trình đưa sản phẩm hoặc dịch vụ đến tay khách hàng. Nó giống như một bản đồ trực quan phát hiện ra những điều không ổn hoặc không hoạt động tốt để doanh nghiệp có thể vận hành trơn tru.
Sau đây là những điểm chính của Bản đồ Dòng giá trị:
• Sử dụng sơ đồ theo kiểu biểu đồ luồng để hiển thị những gì đang diễn ra trong một quy trình.
• Sơ đồ luồng giá trị cho bạn biết điều gì đang tạo ra giá trị và điều gì không.
• Nó giúp phát hiện và loại bỏ những việc như chờ đợi, di chuyển đồ đạc quá nhiều, làm quá nhiều thứ một lúc và mắc lỗi.
• Bản đồ luồng giá trị là về việc thực hiện những cải tiến nhỏ, ổn định theo thời gian để bạn có thể thấy mọi thứ đang trở nên tốt hơn như thế nào.
Phần 2. Bản đồ luồng giá trị là gì? Những cách sử dụng phổ biến
Value Stream Map (VSM) là công cụ hữu ích trong nhiều lĩnh vực khác nhau. Sau đây là một số cách điển hình mà mọi người sử dụng chúng:
• Sản xuất: Nâng cao hiệu quả sản xuất, rút ngắn thời gian thực hiện và đảm bảo chất lượng tốt hơn.
• Ngành dịch vụ: Giúp dịch vụ diễn ra trôi chảy hơn, rút ngắn thời gian chờ đợi của khách hàng và đảm bảo sự hài lòng của khách hàng.
• Thiết lập văn phòng: Cải thiện quy trình làm việc, giảm giấy tờ và loại bỏ những điểm chậm trễ.
• Quản lý chuỗi cung ứng: Tìm ra những sai sót trong chuỗi cung ứng và giúp nhà cung cấp và khách hàng dễ dàng làm việc cùng nhau hơn.
• Nỗ lực tinh gọn: Hỗ trợ các dự án tinh gọn bằng cách phát hiện và loại bỏ bất kỳ bước nào không cần thiết.
• Cải thiện quy trình: Tìm kiếm những cách thức để tiếp tục cải thiện và hiệu quả hơn.
Hiểu được cách thức hoạt động của VSM có thể giúp bạn xác định liệu đây có phải là công cụ phù hợp với nhu cầu và mục tiêu của bạn hay không.
Phần 3. Cách tạo bản đồ luồng giá trị: Các bước
Phân tích này sẽ chỉ cho bạn cách tạo VSM, từ bắt đầu với quy trình cho đến đưa ra những cách làm tốt hơn. Khi hoàn thành hướng dẫn này, bạn sẽ nắm được cách sử dụng VSM để cải thiện quy trình kinh doanh của mình.
Tìm hiểu quy trình: Làm rõ quy trình bạn đang xem xét. Quyết định quy trình bao gồm những gì, chẳng hạn như quy trình bắt đầu và kết thúc ở đâu.
Nhận thông tin: Thu thập thông tin chi tiết về quy trình, như các bước, thời gian thực hiện từng bước và bất kỳ thời gian chờ đợi hoặc di chuyển nào. Cân nhắc sử dụng kiểm tra thời gian hoặc nói chuyện với mọi người để có được thông tin này.
Tạo Bản đồ trạng thái hiện tại: Vẽ sơ đồ đơn giản cho thấy mọi thứ đang diễn ra như thế nào. Bao gồm các hộp cho mỗi bước, mũi tên cho cách mọi thứ di chuyển và ký hiệu cho các loại công việc khác nhau (như công việc tạo ra giá trị hoặc không tạo ra giá trị).
Phát hiện vấn đề: Xem bản đồ trạng thái hiện tại để tìm bất kỳ vấn đề nào với quy trình. Các vấn đề điển hình bao gồm chờ đợi, di chuyển đồ đạc, làm quá nhiều, có quá nhiều thứ, mắc quá nhiều lỗi và không sử dụng tài nguyên hiệu quả.
Lên kế hoạch cho tương lai: Tạo một bản đồ mới cho thấy bạn muốn quy trình diễn ra như thế nào. Loại bỏ hoặc cải thiện những vấn đề bạn tìm thấy. Nghĩ đến việc sử dụng các ý tưởng tinh gọn để mọi thứ diễn ra suôn sẻ hơn.
Đưa Kế hoạch vào Hành động: Lên kế hoạch để bắt đầu thực hiện những thay đổi từ bản đồ trạng thái tương lai. Theo dõi mọi việc đang diễn ra như thế nào và thực hiện bất kỳ thay đổi nào cần thiết.
Tiếp tục cải thiện: Sử dụng VSM để tiếp tục cải thiện quy trình. Tiếp tục kiểm tra và cập nhật VSM để xem quy trình thay đổi như thế nào.
Bằng cách thực hiện những điều này, bạn có thể tạo ra một VSM hữu ích giúp bạn tìm ra cách cải thiện và giúp quy trình của bạn hoạt động trơn tru hơn.
Phần 4. Thành phần và Biểu tượng Bạn Có thể Sử dụng trong Ánh xạ Giá trị
Để tạo ra một VSM tốt, bạn phải hiểu cách các bộ phận và ký hiệu cho các nhiệm vụ và quy trình khác nhau hoạt động. Trong phần này, chúng ta sẽ xem xét các thành phần chính tạo nên VSM, cung cấp cho bạn bản tóm tắt đơn giản về bản chất của chúng và cách sử dụng chúng. Bằng cách nắm bắt các thành phần này, bạn có thể làm cho VSM của mình chi tiết và hữu ích hơn. Hãy cùng tìm hiểu về các ký hiệu và thành phần lập bản đồ luồng giá trị.
Các thành phần của bản đồ luồng giá trị
• Các hộp: Hãy nghĩ về chúng như các bước hoặc nhiệm vụ trong quy trình.
• Mũi tên: Hiển thị cách vật liệu hoặc thông tin di chuyển từ bước này sang bước khác.
• Dữ liệu: Đây là thông tin về quy trình, chẳng hạn như mất bao lâu, có bao nhiêu dữ liệu hoặc tiến độ thực hiện đến đâu.
• Biểu tượng: Có nhiều biểu tượng khác nhau cho nhiều loại nhiệm vụ khác nhau, như:
◆ Chức năng tạo ra giá trị gia tăng: Giúp cải thiện trực tiếp sản phẩm hoặc dịch vụ cho khách hàng.
◆ Các nhiệm vụ không tạo ra giá trị: Các nhiệm vụ không làm cho sản phẩm hoặc dịch vụ tốt hơn.
• Lãng phí: Biểu tượng cho các loại lãng phí khác nhau, chẳng hạn như chờ đợi, di chuyển đồ đạc quá nhiều, làm quá nhiều, có quá nhiều đồ đạc, di chuyển đồ đạc quá nhiều, mắc lỗi và không sử dụng tài nguyên hiệu quả.
Ký hiệu
• Hình tam giác: Hiển thị một bước hoặc nhiệm vụ.
• Kim cương chỉ ra một sự lựa chọn.
• Mũi tên: Hiển thị cách di chuyển của vật thể hoặc thông tin.
• Hàng tồn kho: Một hình tam giác có một đường thẳng cắt ngang.
• Đợi: Một đường chéo có mũi tên.
• Vận chuyển: Một đường thẳng có mũi tên ở cả hai bên.
• Kiểm tra: Một vòng tròn có một con mắt bên trong.
• Chuyển động: Biểu tượng người đang đi bộ.
• Sản xuất quá mức: Một loạt các biểu tượng cho quá nhiều thứ.
• Lỗi: Biểu tượng cho lỗi hoặc vấn đề.
Bạn có thể tạo một VSM đơn giản và hữu ích để giải thích quy trình của mình bằng các bộ phận và ký hiệu này.
Phần 5. Cách đánh giá chất lượng của bản đồ luồng giá trị
Một Bản đồ luồng giá trị (VSM) được xây dựng tốt là một cách tuyệt vời để cải thiện quy trình của bạn. Tuy nhiên, để đảm bảo VSM của bạn hoạt động tốt, bạn phải kiểm tra xem nó tốt như thế nào. Bằng cách xem xét cẩn thận mức độ chính xác, rõ ràng, đầy đủ, sâu sắc và đúng trọng tâm của VSM, bạn có thể xác định những gì cần sửa và tận dụng tối đa nó. Chúng ta sẽ xem xét những điều chính cần kiểm tra khi bạn đánh giá mức độ tốt của VSM, cung cấp cho bạn danh sách đầy đủ để đảm bảo rằng các bản đồ của bạn hữu ích và dễ hiểu. Hãy cùng tìm hiểu VSM của bạn có giá trị như thế nào.
Sự chính xác
• Đảm bảo dữ liệu bạn sử dụng để tạo VSM là chính xác và cập nhật.
• Kiểm tra xem VSM có hiển thị quy trình hiện tại trông như thế nào không.
Độ trong suốt
• VSM phải dễ lấy và trông đẹp mắt.
• Đảm bảo bạn sử dụng các ký hiệu một cách chính xác và nhất quán.
• Mọi thứ đều phải có nhãn rõ ràng, dễ đọc.
Sự hoàn thiện
• Đảm bảo bạn có tất cả các bước và nhiệm vụ quan trọng trong VSM.
• Đảm bảo bạn đã tìm thấy tất cả các loại rác thải khác nhau.
Thông tin chi tiết
• VSM phải chỉ ra được sự khác biệt giữa những thứ tạo ra giá trị và những thứ không tạo ra giá trị.
• Tìm hiểu xem quá trình này có thể diễn ra nhanh hơn ở đâu.
• VSM phải chỉ ra những điểm bạn có thể cải thiện.
Sự phù hợp với mục tiêu
• Đảm bảo VSM phù hợp với các mục tiêu và kế hoạch lớn của công ty.
Bằng cách kiểm tra VSM của bạn thông qua những điểm này, bạn có thể xác định chất lượng của nó và xác định những điểm cần cải thiện.
Phần 6. Các công cụ hữu ích để tạo bản đồ luồng giá trị
Value Stream Mapping (VSM) là một cách tuyệt vời để xem và hiểu cách mọi thứ hoạt động. Để tạo VSM tốt, bạn có thể sử dụng các công cụ phần mềm khác nhau. Phần này sẽ chỉ cho bạn ba lựa chọn phổ biến: MindOnMap, Word và Creately. Mỗi công cụ đều có điểm tốt và điểm xấu, vì vậy, điều quan trọng là chọn công cụ phù hợp với nhu cầu và sở thích của bạn nhất. Hãy cùng xem xét các công cụ này và điểm mạnh của chúng.
Tùy chọn 1. MindOnMap
MindOnMap là một ứng dụng lập bản đồ tư duy tuyệt vời giúp bạn sắp xếp, xem và chia sẻ suy nghĩ của mình. Ứng dụng này có giao diện thân thiện với người dùng và dễ sử dụng để tạo hình ảnh từ thông tin của bạn, rất phù hợp để đưa ra ý tưởng, lập kế hoạch dự án và theo dõi những gì bạn biết. Mặc dù ứng dụng này không chỉ được tạo ra để tạo Bản đồ luồng giá trị (VSM), nhưng bạn có thể sáng tạo khá nhiều.
An toàn tải
An toàn tải
Các tính năng chính của VSM với MindOnMap
• Bố cục cho phép bạn hiển thị cách vật liệu và thông tin di chuyển qua một quy trình.
• Sử dụng hình dạng cho các nhiệm vụ và đường thẳng để thể hiện cách chúng kết nối.
• Sử dụng các màu sắc khác nhau để phân biệt các nhiệm vụ có giá trị và các nhiệm vụ không có giá trị.
• Viết ra thông tin chi tiết về các bước cụ thể hoặc thông tin bổ sung.
• Bạn có thể lập nhóm với người khác ngay trên bản đồ, rất phù hợp cho việc cộng tác hoặc động não.
• Bạn có thể chia sẻ sơ đồ tư duy của mình với người khác theo nhiều cách khác nhau, như hình ảnh, tệp PDF hoặc tệp trong Microsoft Office.
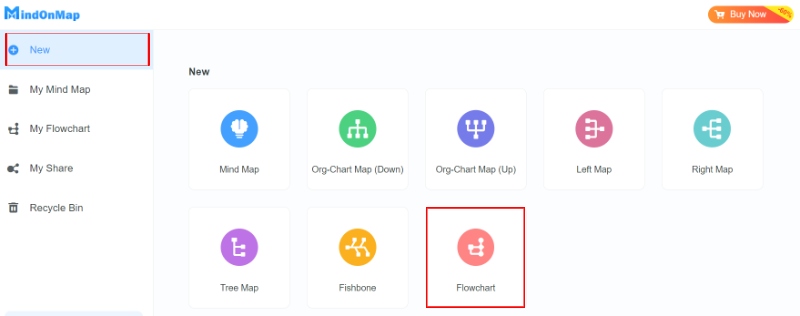
Tải xuống và cài đặt MindOnMap. Đảm bảo đăng nhập bằng tài khoản hiện tại của bạn. Nếu bạn không có tài khoản, đừng lo lắng—bạn có thể tạo một tài khoản mới miễn phí. Sau khi đăng nhập, hãy nhấn nút +New và chọn Flowchart.
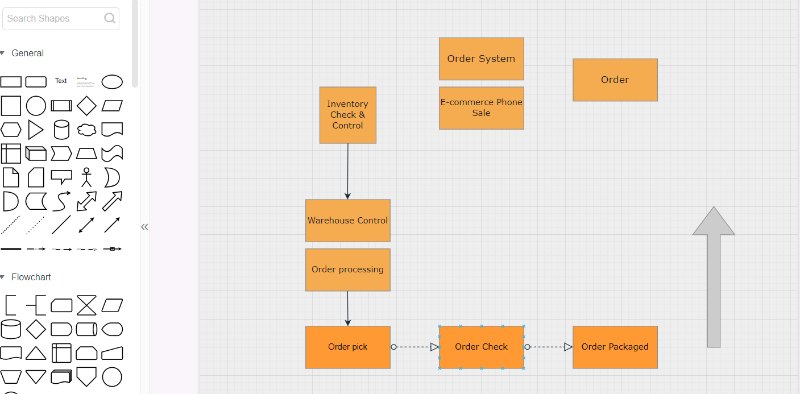
Bắt đầu bằng cách tìm ra các bước chính trong luồng giá trị của bạn. Sử dụng các hình dạng trong thanh công cụ Chung và Sơ đồ luồng. Đặt các hình dạng này theo thứ tự xuất hiện và liên kết chúng bằng các mũi tên để hiển thị cách chúng chảy.
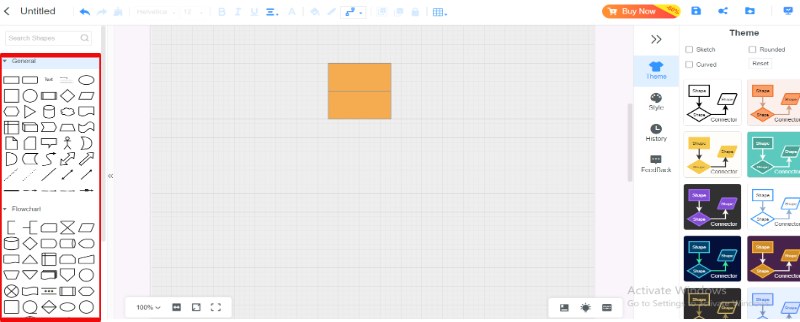
Đặt các hộp dữ liệu bên dưới mỗi bước để bao gồm các chi tiết quan trọng như thời gian cần thiết để hoàn thành một chu kỳ, thời gian cần thiết để chuẩn bị một thứ gì đó, lượng hàng tồn kho chúng ta có hoặc bất kỳ điều gì khác. Sử dụng các màu sắc hoặc ký hiệu khác nhau để phân biệt giữa các hoạt động tạo ra giá trị và những hoạt động không tạo ra giá trị.
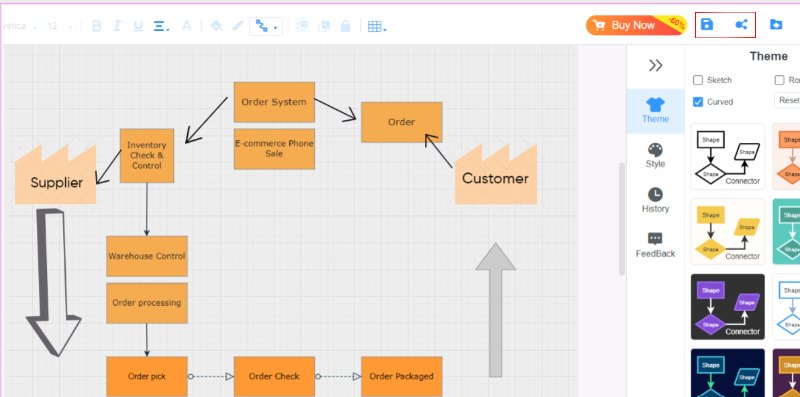
Kiểm tra bản đồ để xem mọi thứ có đúng và đầy đủ không. Đảm bảo tất cả các bước, cách thông tin di chuyển và dữ liệu đều chính xác.
Sau khi hoàn thành VSM, hãy nhớ lưu dự án của bạn. Bạn có thể chia sẻ công việc của mình bằng cách nhấp vào nút Chia sẻ.
Thực hiện theo các quy trình này, bạn có thể tạo Bản đồ luồng giá trị chi tiết và hữu ích với MindOnMap. Công cụ này đơn giản hóa việc lập bản đồ và cung cấp một số tính năng giúp bạn phân tích và cải thiện luồng giá trị của sản phẩm hoặc dịch vụ.
Tùy chọn 2. Microsoft Word
Microsoft Word, một công cụ tài liệu tiện dụng, cũng có thể tạo ra các Bản đồ luồng giá trị (VSM) đơn giản. Mặc dù Word chủ yếu được biết đến để tạo tài liệu, nhưng nó có nhiều tính năng như hình dạng, SmartArt và các công cụ sơ đồ cho phép bạn vẽ ra các quy trình như lập bản đồ luồng giá trị. Mặc dù có thể không tập trung vào phần mềm VSM đặc biệt, nhưng Word dễ sử dụng và phổ biến, vì vậy đây là lựa chọn tốt cho những người chỉ cần tạo VSM cơ bản mà không cần bất kỳ phần mềm bổ sung nào. Sử dụng các công cụ vẽ của Word, bạn có thể phác thảo các bước của một quy trình, cách thông tin di chuyển xung quanh và các con số quan trọng để xem xét và cải thiện luồng giá trị của bạn.
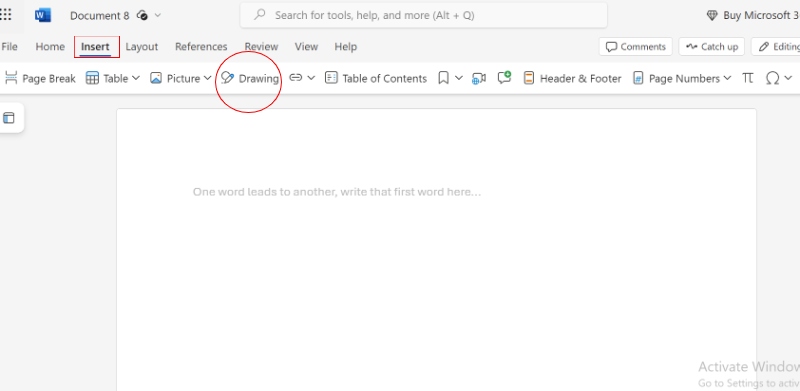
Đầu tiên, hãy mở Microsoft Word và tạo một tài liệu mới, trống. Nhấp vào tab Insert và chọn tùy chọn Drawing.
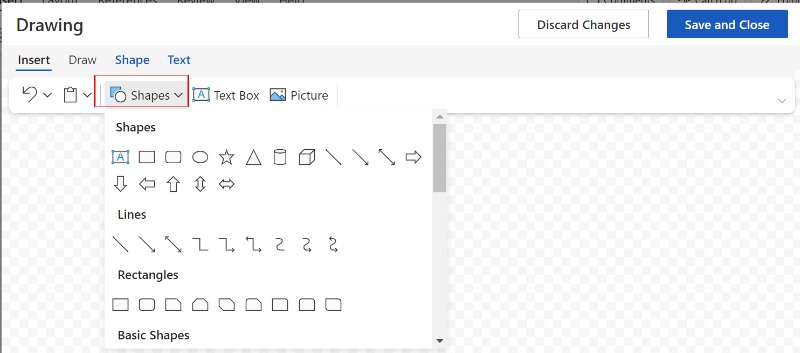
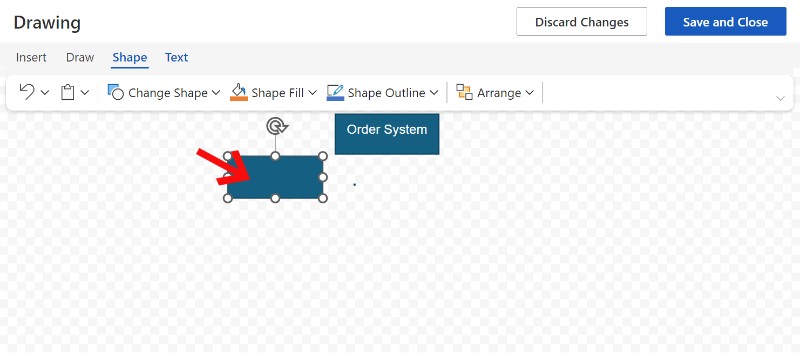
Nhấp vào nút Hình dạng và chọn hình chữ nhật hoặc bất kỳ hình dạng nào khác phù hợp nhất với các bước quy trình của bạn. Sau đó, chỉ cần nhấp và kéo để đặt các hình dạng này vào tài liệu của bạn, sắp xếp chúng theo thứ tự cho thấy quy trình của bạn diễn ra như thế nào.
Để ghi nhãn cho từng bước trong quy trình của bạn, hãy nhấp đúp vào một hình dạng, hình dạng này sẽ thêm Văn bản. Nhập tên quy trình hoặc bước vào bên trong hình dạng. Bạn cũng có thể tô sáng văn bản và tùy chỉnh phông chữ, kích thước và căn chỉnh.
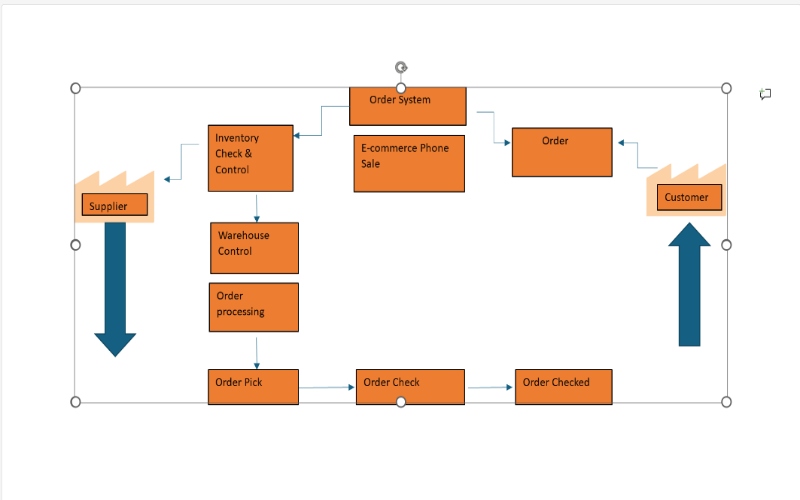
Thêm các biểu tượng như hình tam giác hàng tồn kho, mũi tên hoặc biểu tượng cho khách hàng hoặc nhà cung cấp bằng cách sử dụng nhiều hình dạng khác nhau hoặc chèn hình ảnh nếu cần. Bạn có thể tìm thấy các biểu tượng hoặc ký hiệu này trực tuyến và thêm chúng dưới dạng hình ảnh.
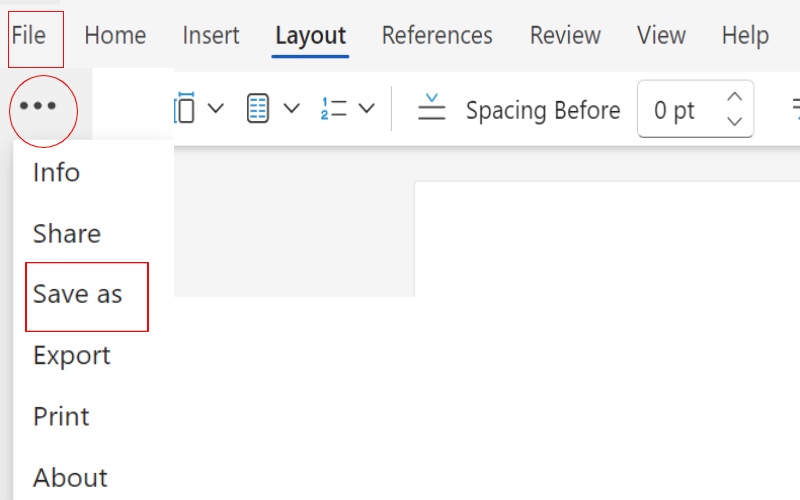
Xem lại VSM của bạn để đảm bảo mọi thứ được dán nhãn chính xác và đúng vị trí. Thực hiện bất kỳ điều chỉnh cần thiết nào đối với bố cục để dễ hiểu hơn. Sau đó, nhấn Tệp Lưu dưới dạng để lưu tài liệu của bạn. Bạn có thể lưu ở định dạng Word hoặc xuất dưới dạng PDF để chia sẻ dễ dàng hơn.
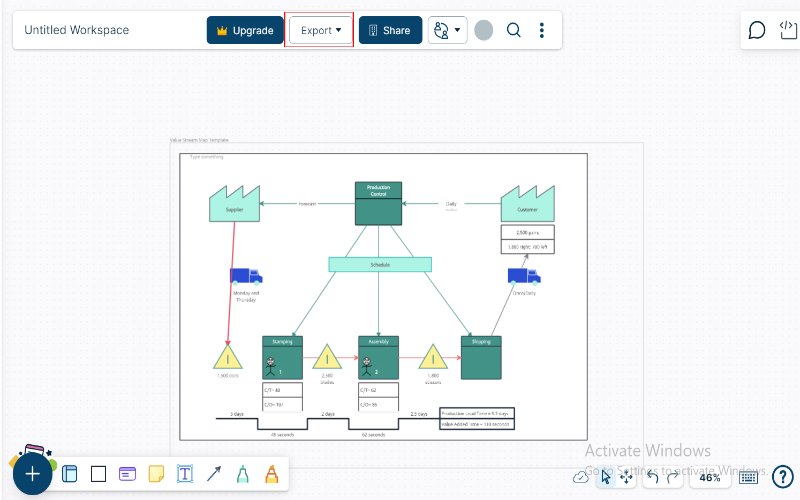
Tùy chọn 3. Creately
Creately là một trang web giúp tạo sơ đồ, sơ đồ luồng công việc và các hình ảnh trực quan khác một cách dễ dàng. Nó rất tuyệt vời cho các nhóm vì nó cho phép mọi người làm việc trên cùng một sơ đồ cùng lúc, được gọi là cộng tác thời gian thực. Sáng tạo có bộ sưu tập lớn các hình dạng và mẫu hoàn hảo cho mọi loại sơ đồ, như Sơ đồ luồng giá trị, do đó rất lý tưởng cho những người biết họ đang làm gì.
Truy cập trang web Creately và đăng ký tài khoản hoặc đăng nhập. Sau khi đăng nhập, nhấp vào Tạo mới và chọn Tài liệu mới. Bạn có thể tìm mẫu Lập bản đồ luồng giá trị hoặc bắt đầu từ đầu.
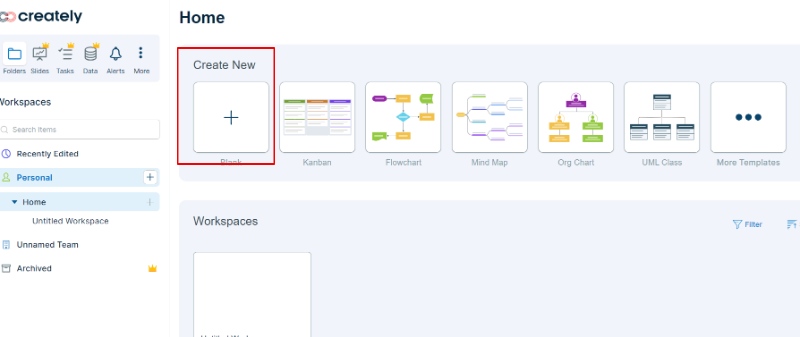
Creately có một số mẫu có sẵn cho VSM. Nếu bạn không có nhiều thời gian, bạn có thể chọn mẫu phù hợp với nhu cầu của mình và chỉnh sửa theo ý thích. Sử dụng bảng hình dạng ở bên trái màn hình để kéo và thả các hộp quy trình vào canvas của bạn. Ghi nhãn từng hộp bằng bước quy trình.
Khi bạn hài lòng với VSM của mình, hãy lưu nó vào tài khoản Creately của bạn. Bạn cũng có thể gửi nó ở các định dạng như PDF, PNG hoặc SVG để dễ dàng chia sẻ và in ấn.
Phần 7. Các câu hỏi thường gặp về Lập bản đồ luồng giá trị
Ba thành phần chính của VSM là gì?
Ba thành phần chính của Sơ đồ luồng giá trị (VSM) là luồng quy trình, luồng thông tin và dòng thời gian. Quy trình luồng là các bước để tạo ra một sản phẩm hoặc cung cấp một dịch vụ. Luồng thông tin là về cách dữ liệu và hướng dẫn di chuyển qua toàn bộ quy trình. Một dòng thời gian cho biết khi nào mọi thứ xảy ra, chẳng hạn như mất bao lâu để thực hiện một việc gì đó và bạn phải đợi bao lâu cho bước tiếp theo. Cùng nhau, các phần này cung cấp cho bạn bức tranh toàn cảnh về cách mọi thứ hoạt động để bạn có thể tìm ra cách cải thiện nó.
Lập bản đồ luồng giá trị là tinh gọn hay Six Sigma?
Value Stream Mapping (VSM) là một công cụ từ phía Lean giúp bạn thấy và làm cho các quy trình của mình hiệu quả hơn bằng cách phát hiện và loại bỏ lãng phí. Mặc dù thường được liên kết với Lean, bạn cũng có thể sử dụng VSM trong các dự án theo phương pháp Six Sigma để tìm ra những điều đang diễn ra không ổn, đặc biệt là khi bạn đang cố gắng tìm ra những gì bạn đang làm và bạn đang làm tốt như thế nào trong các phần Xác định và Đo lường của chu trình DMAIC.
Làm thế nào để tạo VSM trong Excel?
Để tạo Bản đồ luồng giá trị (VSM) trong Excel: Bắt đầu: Mở một trang tính Excel mới và điều chỉnh kích thước cột và hàng. Vẽ Luồng quy trình: Sử dụng các hình dạng để tạo các bước và sắp xếp chúng theo thứ tự. Liên kết các bước: Sử dụng các mũi tên để hiển thị cách các bước được kết nối. Thêm cách thông tin di chuyển: Đặt vào các hộp văn bản hoặc hình dạng để hiển thị cách thông tin chảy và liên kết chúng bằng các mũi tên. Thêm Dữ liệu chính: Thêm các số liệu thống kê quan trọng như thời gian thực hiện mỗi bước. Thêm Dòng thời gian: Đặt một dòng thời gian ở cuối để hiển thị độ dài của từng bước. Kiểu dáng và Hoàn thiện: Làm cho VSM dễ đọc, sau đó nhấn lưu và chia sẻ. Phương pháp này cho phép bạn tạo một VSM đơn giản, có thể chỉnh sửa bằng các công cụ của Excel.
Sự kết luận
Thật là quan trọng để kiểm tra xem một Bản đồ luồng giá trị là để đảm bảo rằng nó cho thấy quy trình như thế nào và chỉ ra những điểm cần cải thiện. Có rất nhiều công cụ bạn có thể sử dụng, như MindOnMap, Microsoft Word và Creately, để tạo VSM và mỗi công cụ đều có những tính năng tuyệt vời giúp việc lập bản đồ dễ dàng hơn. Tóm lại, VSM là một công cụ tiện dụng cho các doanh nghiệp muốn cải thiện quy trình của mình và tiếp tục cải thiện chúng.