Infografika sharhi: Turli usullardan foydalanish bo'yicha bosqichma-bosqich qo'llanma
Infografika murakkab maʼlumotni tushunish oson va koʻrish qiziqarli tarzda koʻrsatishning qulay usulidir. Rasmlar, so'zlar va raqamlarni aralashtirib, infografika hatto eng qiyin g'oyalarni ham oson qabul qilish imkonini beradi. Ushbu toʻliq qoʻllanmada biz infografikani boshidan oxirigacha koʻrib chiqamiz, ular nima uchun oʻrganib qolganligidan tortib, oʻzingiznikini yaratishgacha. Biz yaxshi infografikani nima qilishini ko'rib chiqamiz, ulardan qachon foydalanish haqida gaplashamiz va MindOnMap va boshqalar kabi vositalar yordamida ularni yaratish bo'yicha sizga oson bajariladigan ko'rsatmalar beramiz. Ushbu qo'llanma sizni diqqatni tortadigan infografika yaratish uchun kerak bo'lgan barcha narsalarni taqdim etadi. Shunday qilib, keling, infografika olamiga o'taylik va ular sizning hikoyalaringiz va vizual xabarlaringizni qanday qilib ommalashtirishi mumkinligini ko'rib chiqamiz.

- 1-qism. Infografika nima
- 2-qism. Nima uchun infografikadan foydalanish kerak
- 3-qism. Infografika nimalardan iborat
- 4-qism. Infografikadan umumiy foydalanish
- 5-qism. Infografikani qanday qilish kerak
- 6-qism. Infografika haqida tez-tez so'raladigan savollar
1-qism. Infografika nima
Infografika axborot, maʼlumot yoki bilimlarni tez va oson olish mumkin boʻlgan tarzda namoyish etishning ajoyib usulidir. U ma'lumot almashishni qiziqarli va sodda qilish uchun rasmlar, diagrammalar va bir oz matnni aralashtirib yuboradi. Infografika ma'lumotlarning katta qismini parchalash, naqsh yoki tendentsiyalarni ko'rsatish yoki murakkab jarayonlarni ajoyib va oson kuzatib borish uchun ajoyib.
Infografikani ajoyib qiladigan narsa
• Ular vizual jihatdan jozibali: infografika e’tiboringizni jalb qilish uchun yorqin ranglar, qiziqarli piktogrammalar, rasmlar va ajoyib shriftlardan foydalanadi.
• Ular ma'lumotlarni hazm qilishni osonlashtiradi: ular murakkab ma'lumotlarni oladi va tushunishni osonlashtiradi, ko'pincha asosiy fikrlarni ta'kidlash uchun grafiklar, diagrammalar yoki qisqa nuqtalardan foydalanadi.
• Ular hikoya qiladilar: Infografikada ko'pincha hikoya yoki narsalarni bosqichma-bosqich ko'rsatish usuli mavjud bo'lib, uni kuzatib borish oson.
• Ularni tushunish oson: Infografika oddiy, shuning uchun har kim mavzu haqida qanchalik bilishidan qat'i nazar, ularni tushunishi mumkin.
Infografika - bu marketing, o'rganish, yangiliklar va ma'lumotni aniq va samarali almashish muhim bo'lgan boshqa ko'plab sohalarda juda mashhur grafik.
2-qism. Nima uchun infografikadan foydalanish kerak
Infografika - bu ma'lumotni tushunish oson va ko'rish qiziqarli tarzda ko'rsatish uchun rasmlar, diagrammalar va atigi bir oz matnni aralashtirgan ajoyib vizual vositalar. Siz undan murakkab ma'lumotlarni soddalashtirish, hikoyalar aytib berish va odamlarga ularni olishga yordam berish uchun hamma joyda foydalanishingiz mumkin. Infografika nima uchun juda zo'r bo'lishining bir necha sabablari:
• Murakkab mavzularni olish oson bo‘lsin: Tushunish qiyin bo‘lgan ma’lumotlarni tomoshabinlar bosadigan oddiy rasmlarga bo‘ling.
• Ularning diqqatini jamlang: Infografika ko‘zni qamashtiradi, ya’ni ular ko‘proq bo‘lishish va odamlarning ongida qoladi.
• Tushunishni kuchaytiring: Rasmlar odamlarga oddiy so'zlardan ko'ra narsalarni tushunishni osonlashtiradi.
• Xotirani kuchaytirish: Bizning miyamiz suratlar bilan ishlashda yaxshiroq, shuning uchun infografika odamlar narsalarni uzoqroq eslab qolishlarini ta'minlashning ajoyib usuli hisoblanadi.
• Ularni jalb qiling: Infografika odamlarni suhbatlashishga va tarkibingizga kirishga undashi mumkin.
Infografika yaratish - bu ma'lumotni tushunish oson va ko'zni qamashtiradigan tarzda almashishning ajoyib usuli. Ular murakkab ma'lumotlarni aniq va qiziqarli rasmlarga aylantirib, ularni o'qitish, marketing, hisobotlar va boshqalar uchun foydali qiladi. Infografika odamlarni ko'proq jalb qiladi, ularga ma'lumotni yaxshiroq eslab qolishga yordam beradi va xabaringizni turli platformalarda va boshqa odamlar bilan yanada kengroq va kengroq tarqatadi.
3-qism. Infografika nimalardan iborat
Infografika ma'lumotni qiziqarli va tushunarli tarzda ko'rsatish uchun birlashtirilgan asosiy qismlardan iborat. Elementlarni ko'rsatadigan infografikada odatda nima topasiz.
• Sarlavha: Infografika haqida tezda aytib beradigan oddiy va tushunarli sarlavha.
• Rasmlar: Umumiy ma'lumot yoki ma'lumotni ko'rsatadigan rasmlar, diagrammalar yoki belgilar.
• Matn: fon, ismlar yoki qo‘shimcha ma’lumot beruvchi tavsiflovchi matn.
• Ranglar: Bir-biriga mos keladigan va infografikani ko‘rish va o‘qishni osonlashtiradigan ranglar to‘plami.
• Shriftlar: O‘qish oson va butun dizaynga mos keladigan shrift.
• Sahifa tartibi – bu sahifadagi narsalarni kuzatish oson va muvozanatli ko‘rinishini ta’minlash uchun qanday joylashtirilishi.
• Harakatga chaqiruv: odamlarni biror narsa qilishga undaydigan kuchli, aniq xabar.
Ushbu qismlarni yaxshilab aralashtirish sizga yaxshi ko'rinadigan va odamlarga narsalarni aytib beradigan infografika yaratish imkonini beradi.
4-qism. Infografikadan umumiy foydalanish
Infografika ko'p jihatdan qulay vositadir. Odamlar ulardan foydalanadigan asosiy narsalardan ba'zilari:
• Ma'lumotlarni tushunishni oson qilish: murakkab ma'lumotlarni oddiy va olish oson narsaga aylantirish.
• Og'ir narsalarni o'rgatish: rasmlar yordamida murakkab mavzularni o'rganishni qiziqarli va qiziqarli qilish.
• Marketing: Eng yaxshi qismlarga e'tibor qaratish orqali mahsulot yoki xizmatni nima ajoyib qilishini ko'rsatish.
• Ijtimoiy media: so'zni tarqatish va ijtimoiy tarmoqlarda odamlar bilan bog'lanish.
• Hisobotlarni yaxshi ko'rsatish: tadqiqot yoki topilmalarni ko'zni qamashtiradigan tarzda namoyish qilish.
• Ishlar qanday ishlashini tushuntirish: murakkab jarayonlar yoki ish oqimlarini ko'rishni osonlashtiradi.
• Rasmlar va maʼlumotlar yordamida hikoyalarni aytib berish: hikoyalarni vizual va maʼlumot beruvchi tarzda baham koʻrish.
• Biznes: Marketing, sotish va hisobotlarni tayyorlash.
• Ta'lim: o'qitish, o'qitish va tadqiqot.
• Sog'liqni saqlash: Tibbiy ma'lumot yoki tadqiqot natijalarini almashish.
• Texnologiya: Murakkab g‘oyalarni parchalash yoki mahsulot nimaga qodirligini ko‘rsatish.
• Ijtimoiy fanlar: Davlat siyosatiga oid tadqiqotlar yoki g‘oyalarni almashish.
Infografikaning qanchalik ko'p qirrali ekanligini bilib, ulardan ehtiyojlaringizga mos keladigan turli usullarni topishingiz mumkin.
5-qism. Infografikani qanday qilish kerak
Infografika murakkab ma'lumotlarni osongina olish mumkin bo'lgan tarzda ko'rsatish uchun ajoyib. Rasmlar, so'zlar va raqamlarni aralashtirib, infografika e'tiboringizni jalb qiladi, narsalarni aniqlaydi va sizni ko'proq jalb qiladi. Ushbu qo'llanmada ko'zni qamashtiruvchi infografika yaratish uchun to'rtta asosiy vosita ko'rib chiqiladi: MindOnMap, Canva va Visme. Har bir vosita o'ziga xos xususiyatlarga ega, shuning uchun siz o'zingizning ehtiyojlaringizga va ularni yaratishda mahorat darajangizga mos keladiganini tanlashingiz mumkin.
1-usul. MindOnMap (Eng yaxshi infografika yaratuvchisi)
Infografika - bu ma'lumotni rasmlarda taqdim etishning ajoyib usuli bo'lib, qiyin ma'lumotlarni tushunishni osonlashtiradi va yanada qiziqarli qiladi. MindOnMap Bu sizga ong xaritalari, oqim diagrammalari va infografikalarni shov-shuvsiz yaratish imkonini beruvchi qulay onlayn vositadir. Talaba, o‘qituvchi, marketolog yoki biznesda ishlaydigan odam bo‘lasizmi, MindOnMap yordamida infografika yaratishda o‘z fikrlaringiz bilan bo‘lishish ancha osonlashadi.
Xavfsiz yuklab olish
Xavfsiz yuklab olish
Nega MindOnMap yordamida infografikaga borish kerak?
MindOnMap-da oddiy va ishlatish uchun qulay sozlamalar va ko'plab turli shablonlar mavjud bo'lib, ular infografikani endigina boshlayotgan bo'lsangiz ham, tort bo'lagiga aylantiradi. Bu sizga piktogrammalar, rasmlar va jadvallar kabi ajoyib narsalarni so‘zlar bilan aralashtirib, fikringizni aniq ifodalaydigan ko‘zni qamashtiruvchi infografika yaratish imkonini beradi. Bundan tashqari, u bulutga asoslanganligi sababli, siz istalgan joydan narsalaringizni ustida ishlashingiz va sozlashingiz mumkin, bu esa boshqalar bilan birlashishni osonlashtiradi.
Mening shaxsiy tajribam
MindOnMap-ni infografika yaratish uchun birinchi marta sinab ko'rganimda, sudrab-tashlash funksiyasi foydalanuvchilarga qanchalik qulay ekanligi meni hayratda qoldirdi va bu menga turli xil sozlamalar bilan muammosiz o'ynash imkonini berdi. Bundan tashqari, qanday qilib sozlashingiz mumkin, men buni o'zim xohlagan tarzda qilishim mumkinligini anglatadi. Mening e'tiborimni tortgan narsa bu murakkab g'oyalarni qanday qilib yaxshi va tushunarli qilib ko'rsatishi edi. Bu infografikani nafaqat ma'lumotlarga to'la, balki odamlarning e'tiborini tortadigan narsaga aylantirdi.
MindOnMap yordamida infografikani qanday ishlatish bo'yicha qadamlar quyida keltirilgan
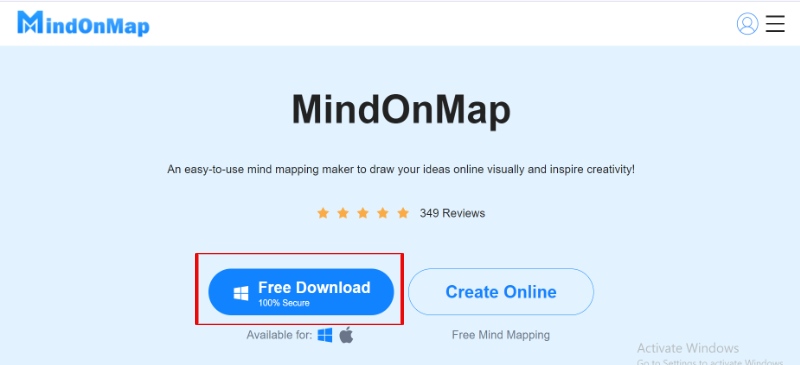
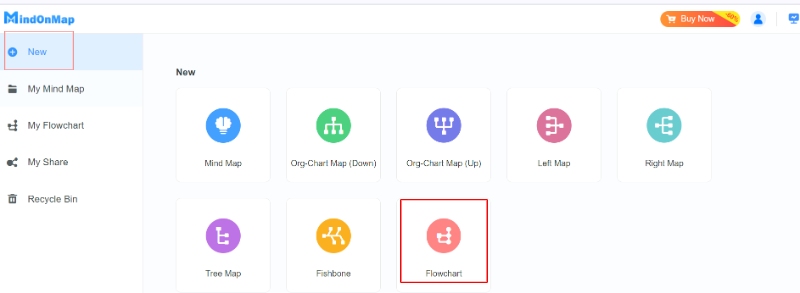
Birinchidan, MindOnMap-da bepul hisob qaydnomasi uchun ro'yxatdan o'ting. Hammasi tayyor bo'lgach, asboblar panelini tekshirish uchun tizimga kiring. Shuningdek, siz onlayn hisob yaratishingiz mumkin.
Yangi hujjat bo'limiga o'ting. Turli shablonlarni ko'rib chiqing va oqim sxemasini tanlang.
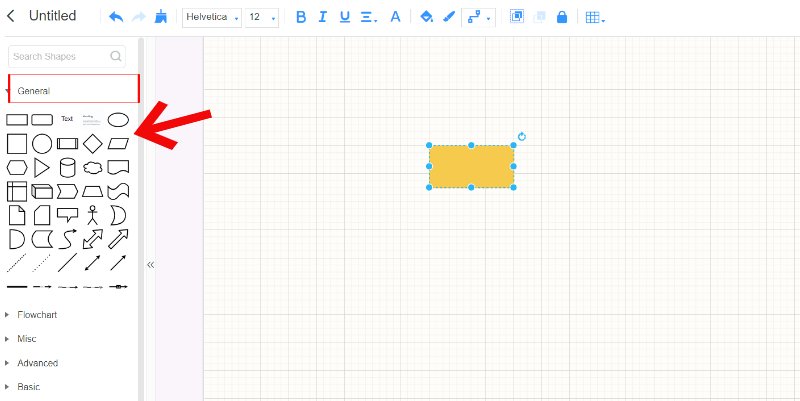
Siz infografikani yaratishni boshlashingiz mumkin. Kerakli qismlarni bo'sh joyga ko'chirish va tushirish uchun Umumiy tugmasini bosing. Keyin siz tanlagan shakllarning qanchalik kattaligini ham sozlashingiz mumkin. Matn qutilari, tasvirlar, piktogrammalar va diagrammalar kabi narsalarni aylanib o'tish uchun o'ynang.
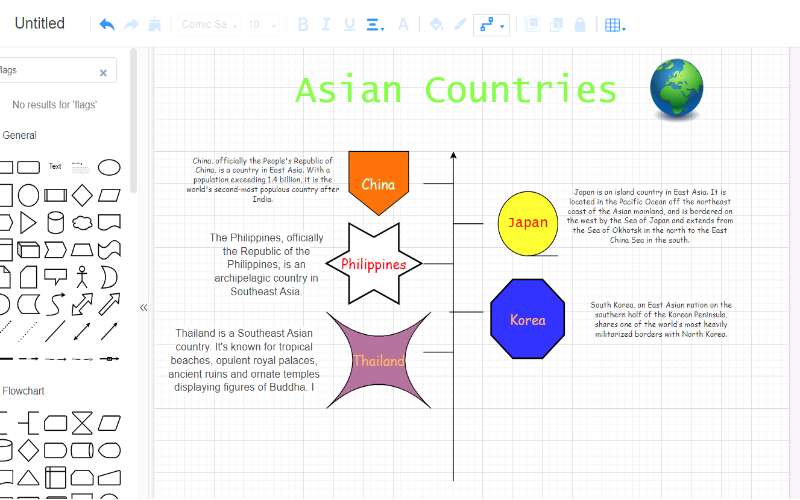
Diagrammalar, grafiklar va rasmlar qo'shish orqali infografikangizni ommalashtiring. MindOnMap-da siz foydalanishingiz mumkin bo'lgan ko'plab piktogramma va rasmlar mavjud yoki o'zingiznikini yuklashingiz mumkin.
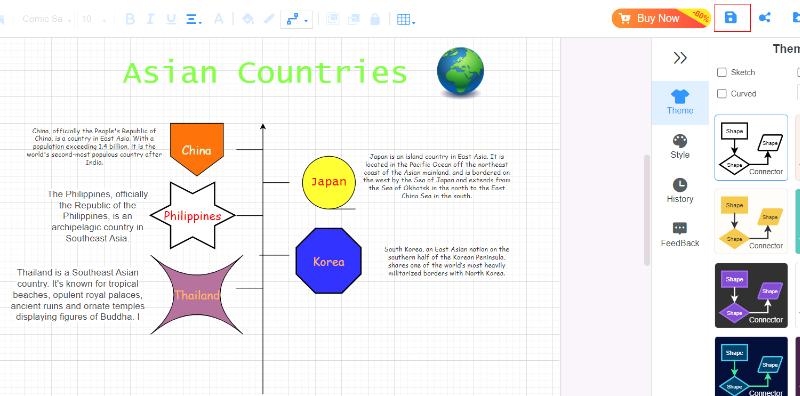
Saqlash tugmasini bosishdan oldin infografikani koʻrib chiqing, uning aniq, aniq va jozibali ekanligiga ishonch hosil qiling. Undan mamnun bo'lganingizdan so'ng, uni saqlang.
MindOnMap yordamida infografika yaratish oson va maʼlumotlaringizni namoyish etish uslubingizni oshirishi mumkin. Ilovadan foydalanish oson va dizayn haqida koʻproq maʼlumotga ega boʻlishingiz kerak boʻlsa ham, yuqori darajadagi infografikani yaratish uchun zarur boʻlgan barcha ajoyib funksiyalarga ega. Maʼlumotlar tendentsiyalarini tahlil qilyapsizmi, biror narsa qanday ishlashini koʻrsatasizmi yoki tadqiqotingizni yakunlayapsizmi, MindOnMap kontentingizni ajoyib va oson olish uchun kerak boʻlgan hamma narsaga ega.
2-usul. Canva
Canva ajoyib grafikalar yaratish uchun moʻljallangan onlayn vositadir, chunki undan foydalanish oson va tanlash uchun juda koʻp lavhalar, rasmlar va dizayn buyumlari mavjud. Bu infografika yaratish uchun juda yaxshi, xoh yangi boshlayotgan bo‘lsangiz, xoh professional. Canva sizga narsalarni sudrab olib tashlash va ularni juda ko'p sozlash imkonini beradi, bu esa ko'zni qamashtiruvchi va foydali infografika yaratishni osonlashtiradi. Canva sizning g'oyalaringizni vizual tarzda amalga oshirish uchun kerak bo'lgan hamma narsaga ega.
Canva yordamida infografikani qanday yaratish bo'yicha qadamlar
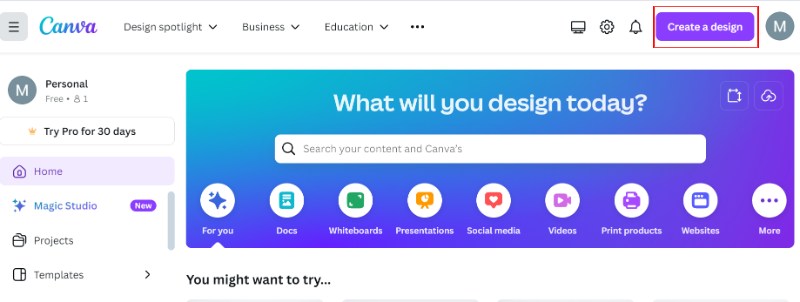
Canva veb-saytiga o'ting va bepul hisob qaydnomasi uchun ro'yxatdan o'ting. Shuningdek, siz Google yoki Facebook hisob qaydnomangiz orqali tizimga kirishingiz mumkin. Kirganingizdan so'ng, Dizayn yaratish tugmasini bosing. Qidiruv satriga Infographic-ni kiriting va paydo bo'lganini tanlang.
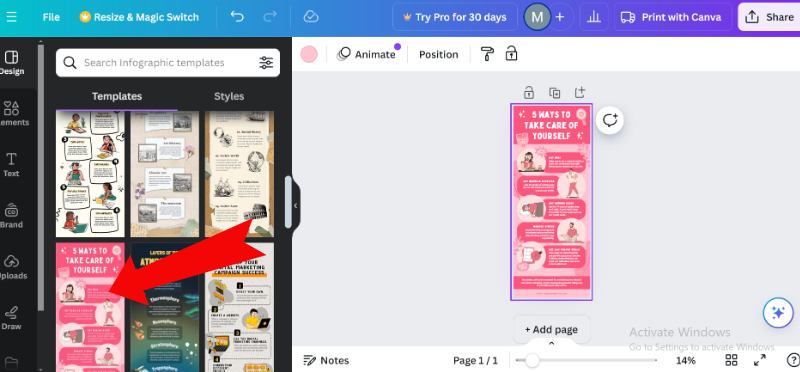
Canva-da infografika uchun juda ko'p bepul andozalar mavjud. Ularda nima borligini tekshiring va maqsadlaringizga mos keladiganini tanlang. Bundan tashqari, noldan boshlashingiz mumkin.
Canva infografikangizni sozlashni juda oson qiladi. Narsalarni siljitish, yangi bit qo'shish va tartibni o'zgartirish uchun sudrab tashlash xususiyatidan foydalaning. Matn qutilari, shakllar, chiziqlar va boshqalarni shunchaki bosish orqali qo'yishingiz mumkin.
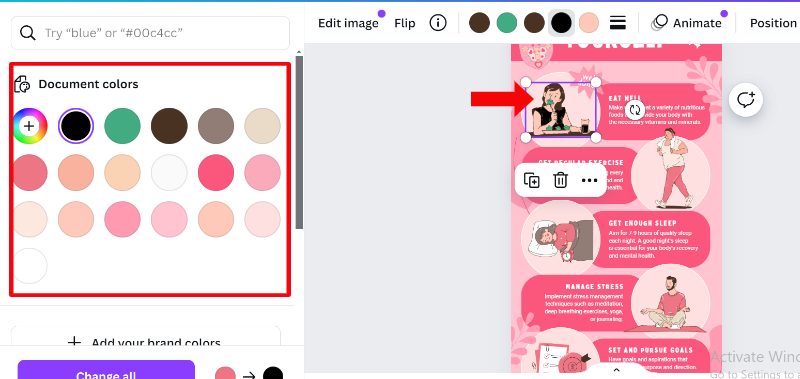
Tahrirlashni boshlash uchun istalgan matn maydonini bosing. Maʼlumotlaringizni aniq va qisqa boʻlishiga ishonch hosil qilib kiriting. Ma'lumotlarni ommalashtirish uchun Canva kutubxonasidan diagrammalar, grafiklar yoki piktogrammalarni qo'shishingiz mumkin.
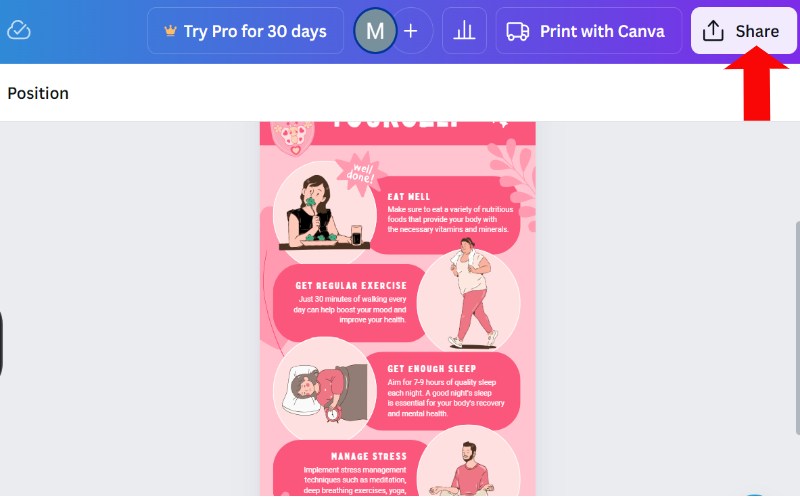
Dizayningizdan mamnun bo'lganingizdan so'ng, yuqori o'ng burchakdagi "Ulashish" yoki "Yuklab olish" tugmasini bosing.
Canva barcha mahorat darajalari uchun infografik yaratishni soddalashtiradi. Unda infografikangizni chiroyli ko‘rinishga keltirish va fikringizni tushuntirish uchun foydalanishingiz mumkin bo‘lgan bir qancha andozalar va narsalar mavjud. Canvas sizning infografikangiz qiziqarli va ma'lumotlarga to'la bo'lishini ta'minlash uchun sizga vositalarni taqdim etadi.
3-usul. Visme
Visme - bu ko'zni qamashtiruvchi infografika, slayd-shou, hisobot va boshqalarni yaratish uchun ajoyib onlayn vositadir. Foydalanish oson va tashqi ko'rinishini o'zgartirish uchun ko'plab imkoniyatlar mavjud, shuning uchun u o'z fikrlarini vizual ravishda baham ko'rishni xohlaydigan yangi boshlanuvchilar va professionallar uchun juda yaxshi. Siz maʼlumotlarni namoyish qilyapsizmi, maʼlumotlarni parchalayapsizmi yoki koʻzni qamashtiruvchi reklama grafikasini yaratasizmi, Visme infografikangizni qiziqarli va oson qilish uchun kerak boʻlgan hamma narsaga ega.
Visme yordamida qanday qilib infografikani yaratish mumkin
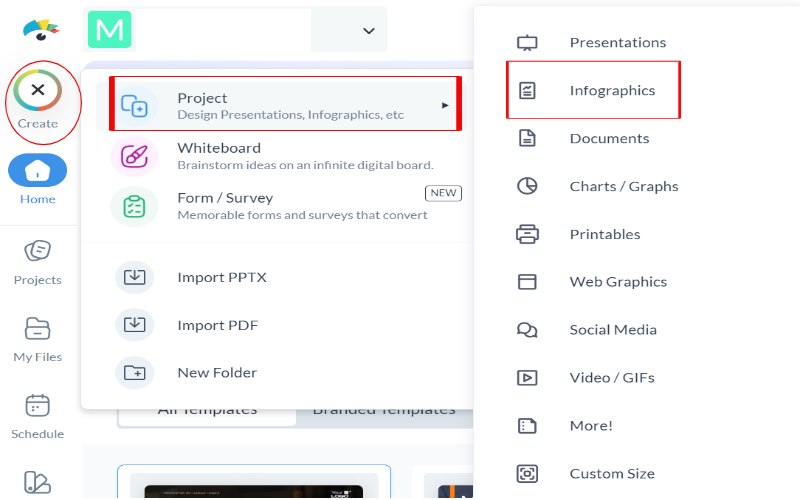
Visme veb-saytiga o'ting va bepul hisob qaydnomasi uchun ro'yxatdan o'ting. Agar siz allaqachon a'zo bo'lsangiz, shunchaki tizimga kiring. Kirganingizdan so'ng Visme boshqaruv panelini ko'rasiz. Yaratish tugmasini bosing, Loyihani oching va variantlardan Infografikani tanlang.
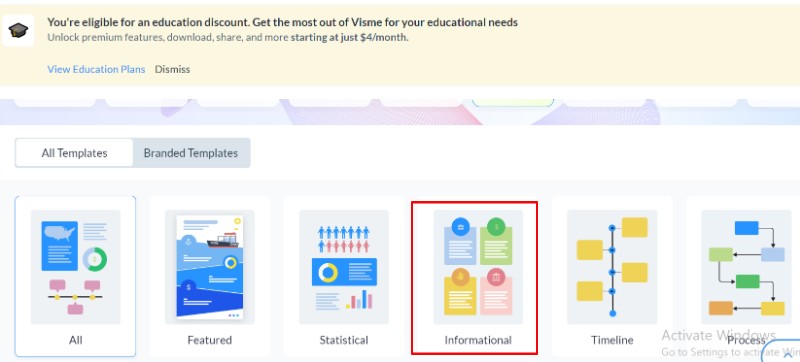
Visme-da toifalar bo'yicha saralangan bir qancha infografik shablonlar mavjud. Ular orqali o'tishingiz yoki kerakli narsani topish uchun qidiruv panelidan foydalanishingiz mumkin. Uni o'zingiz qilishni boshlash uchun o'zingiz yoqtirgan narsani bosing. Agar siz noldan boshlamoqchi bo'lsangiz, bo'sh tuvalni tanlang.
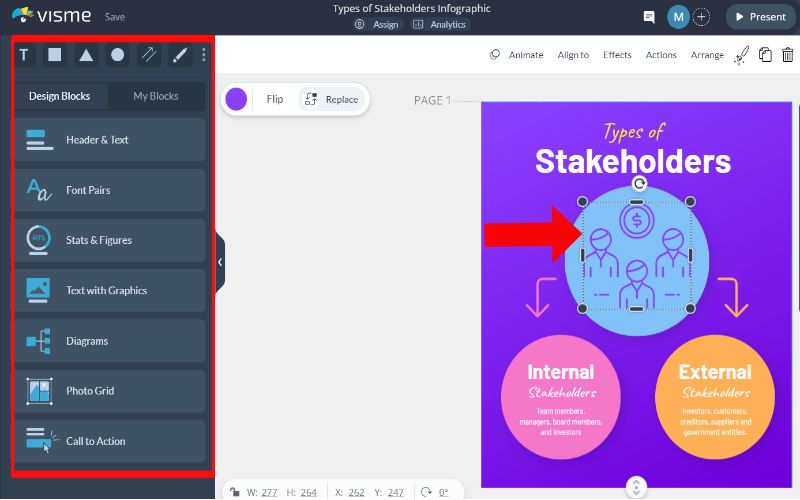
Siz tanlagan shablonni o'zgartirish uchun Visme-ning sudrab olib tashlash muharriridan foydalaning. Siz asboblar panelidan qismlarni ko'chirishingiz, o'lchamini o'zgartirishingiz yoki o'chirishingiz va yangilarini qo'shishingiz mumkin. Matnni o'zgartirish uchun matn maydonchalarini bosing yoki ko'proq tarkib uchun qo'shimcha matn qutilarini qo'shing. O'zingizning brendingiz yoki infografikangizning vibesiga mos keladigan ranglar va uslublarni o'zgartiring.
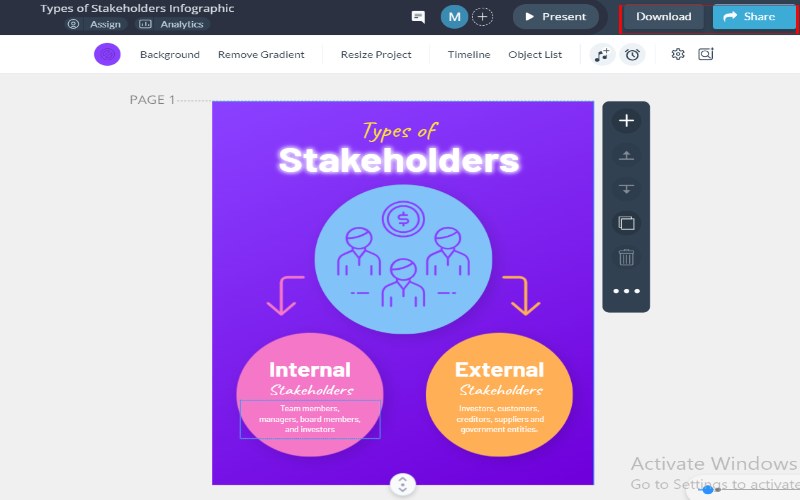
Endi siz infografikani saqlashingiz mumkin. Faqat Ulashish yoki Yuklab olish tugmasini bosing.
Visme - bu professional infografika yaratishni osonlashtiradigan ajoyib va ishlatish uchun qulay vosita. Unda shablonlar va dizayn buyumlarining katta to‘plami, shuningdek, sudrab olib tashlash funksiyasi mavjud bo‘lib, u yuqori darajadagi vizual narsalarni yaratmoqchi bo‘lgan har bir kishi uchun mukammal qiladi.
6-qism. Infografika haqida tez-tez so'raladigan savollar
Infografikani qanday baholaysiz?
Yaxshi infografika ko‘rish va tushunish oson bo‘lgan dizayn bilan aniq, foydali ma’lumotlarni birlashtiradi. Ushbu fikrlarga asoslangan infografikani ko'rib chiqish orqali siz nafaqat ko'rish yoqimli, balki o'z fikrlarini odamlarga etkazishiga ishonch hosil qilishingiz mumkin.
Infografika uchun qaysi dastur yaxshiroq?
Har bir dasturning yaxshi tomonlari bor, shuning uchun qaysi biri to'g'ri bo'lishi sizning ehtiyojlaringizga bog'liq. Agar siz oson va tez narsani xohlasangiz, Canva juda yaxshi. Visme - bu foydalanish uchun qulay narsalarni xohlaydigan, ammo baribir ko'p xususiyatlarga ega bo'lganlar uchun qattiq tanlovdir. MindOnMap juda ko'p nazorat va narsalarni sozlash qobiliyatiga muhtoj odamlar uchun juda mos keladi.
Canva infografika uchun yaxshimi?
Canva - bu infografikani yaratish uchun ajoyib vosita, ayniqsa siz foydalanish uchun oddiy narsa, dizayn variantlari ko'p va uni o'rganish uchun ozgina vaqt kerak bo'lsa. Bu ko'zni qamashtiruvchi infografikani tez va oson yaratmoqchi bo'lgan marketologlar, o'qituvchilar, bloggerlar va kichik biznes uchun juda mos.
Xulosa
Infografika murakkab ma'lumotlarni tushunishni osonlashtirish uchun juda yaxshi. U qiziqarli va aniq kontent yaratish uchun matn, rasmlar va ma'lumotlardan foydalanadi. Ular ta'lim, marketing va ma'lumotlarni vizualizatsiya qilishda mashhurdir, chunki ular odamlarni qiziqtirishga va ma'lumotni yaxshiroq eslab qolishlariga yordam beradi. MindOnMap, Visme va Canva kabi vositalar har kimga turli ehtiyoj va ko‘nikmalar uchun turli funksiyalarga ega infografika yaratishni osonlashtiradi. Muloqotda infografikadan foydalanish xabaringizni yanada esda qolarli va kuchliroq qilishi mumkin.