Problem Çözmeye Yönelik Görsel Bir Kılavuz: 4 Yöntem Kullanılarak Bir Bant Diyagramı Nasıl Yapılır
Bant diyagramları, çubuk modelleri veya şerit diyagramları olarak da adlandırılır, matematik problemlerini anlamanızı ve çözmenizi kolaylaştırabilecek harika görsel yardımcılardır. Sayıları dikdörtgenler veya çubuklar olarak gösterirler, size şeylerin nasıl ilişkili olduğuna dair net bir resim verir ve şeyleri anlamanızı kolaylaştırırlar. Bu kılavuzda, farklı yollara bakacağız bant diyagramı nasıl yapılır, böylece problemleri çözmek için bu süper kullanışlı numarayı kavrayabilirsiniz. İster öğrenci, ister öğretmen veya sadece yardım eden bir ebeveyn olun, bant diyagramlarını kavramak matematik becerilerinizi ve özgüveninizi artırabilir. Bant diyagramlarına atlayalım ve matematik problemlerini çözmeyi nasıl çocuk oyuncağı haline getirebileceklerini görelim.

- Bölüm 1. Bant Diyagramı Nedir?
- Bölüm 2. Bant Diyagramı Nasıl Kullanılır
- Bölüm 3. MindOnMap ile Bant Diyagramı Nasıl Yapılır
- Bölüm 4. 3 Diğer Araçla Bant Diyagramı Nasıl Yapılır
- Bölüm 5. Bant Diyagramı Nasıl Yapılır Hakkında SSS
Bölüm 1. Bant Diyagramı Nedir?
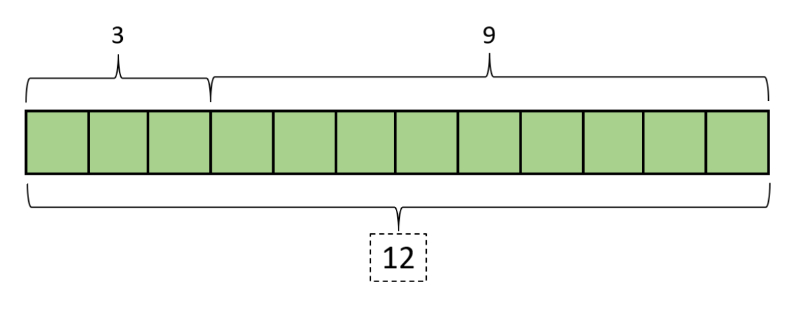
Bir bant diyagramı, sayılar, oranlar ve farklı miktarların birbirleriyle nasıl ilişkili olduğuyla ilgili problemleri göstermek için matematikte kullanışlı bir araçtır. Gerçek yaşam boyutlarına benzeyecek şekilde çizilmiş çubuklardan veya bantlardan oluşur ve her çubuk belirli bir değeri veya miktarı gösterir.
Bant Diyagramları Hakkında Önemli Noktalar
• Sayılar ve nicelikler arasındaki ilişkiyi görmenizi kolaylaştırır, matematik problemlerini daha iyi anlamanıza ve çözmenize yardımcı olur.
• Farklı bir miktarı temsil eden parçaları göstermek için harikadır.
• Özellikle oran ve orantılarla uğraşırken, bir şeyin miktarını diğerine kıyasla karşılaştırmak için gerçekten iyidir.
• Zor problemleri daha küçük ve daha kolay görülebilen parçalara bölmek, matematik problemlerini çözmeyi daha az korkutucu hale getirir.
Bölüm 2. Bant Diyagramı Nasıl Kullanılır
Bu kılavuz, matematik problemlerini ele almak için bir bant diyagramının nasıl çizileceğini gösterecektir. Bant diyagramları yapmayı ve onlara bakmayı öğrenerek, problemleri daha iyi çözebilir ve matematik fikirlerini daha iyi kavrayabilirsiniz.
Durumda hangi sayıların önemli olduğunu anlayın. Hangi sayının toplam, hangisinin parça olduğunu belirleyin.
Toplam miktarı göstermek için dikdörtgen veya çubuk gibi bir şekil çizin. Daha sonra, verilen bilgilere göre şekli parçalara bölün.
Her parçanın ne kadar değerli olduğunu veya ne kadar olduğunu yazın. Sayıların nasıl ilişkili olduğunu görmek için resme bakın.
Diyagramı kullanarak denklemler oluşturabilir veya matematik işlemleri yapabilirsiniz.
Bölüm 3. MindOnMap ile Bant Diyagramı Nasıl Yapılır
MindOnMap düşüncelerinizi, fikirlerinizi ve projelerinizi görsel olarak düzenlemenizi kolaylaştıran en iyi çevrimiçi araçtır. İster sadece fikirlerinizi ortaya atın, ister bir sonraki hamlelerinizi planlayın veya bir şeyi anlamaya çalışın, zihin haritaları, akış şemaları ve her türlü diyagram oluşturmak için harikadır. Öğrenciler, öğretmenler, çalışanlar ve ekipler gibi her kesimden insan, karmaşık şeyleri anlaşılır, net ve kolay görülebilir diyagramlara bölerek daha kolay anlaşılır hale getirmenin basit ama etkili bir yolu olduğu için onu sever. MindOnMap'i diğerlerinden ayıran şey, zihin haritaları ve diyagramlar oluşturmada gelişmeniz gerekse bile kolay kullanımıdır. Gerçek zamanlı olarak birlikte şeyler üzerinde çalışma, farklı şablonlar arasından seçim yapma ve cihazınızla her yerden üzerinde çalışma gibi özelliklere sahiptir. MindOnMap, işleri daha hızlı halletmek, şeyleri daha iyi kavramak ve düşüncelerinizi başkalarıyla paylaşmak için mükemmeldir. İster kişisel şeyler, ister okul projeleri veya bir ekiple çalışmak için kullanın, MindOnMap tüm
Güvenli indirme
Güvenli indirme
MindOnMap'te bant diyagramlarının nasıl kullanılacağına dair adımlar
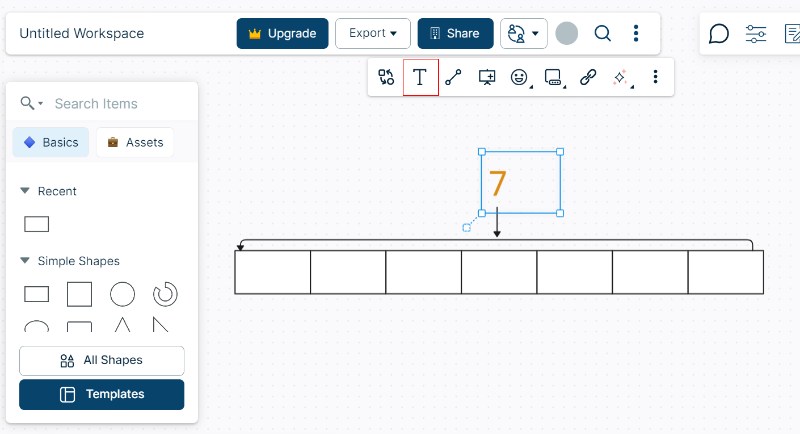
Arama motorunda MindOnMap'i arayın. İndirebilir veya çevrimiçi olarak ücretsiz kullanabilirsiniz. Verilerinizi düzenleyin. Hangi sayılar veya değerlerle uğraştığınız konusunda net olduğunuzdan emin olun ve Akış Şeması'nı seçin.
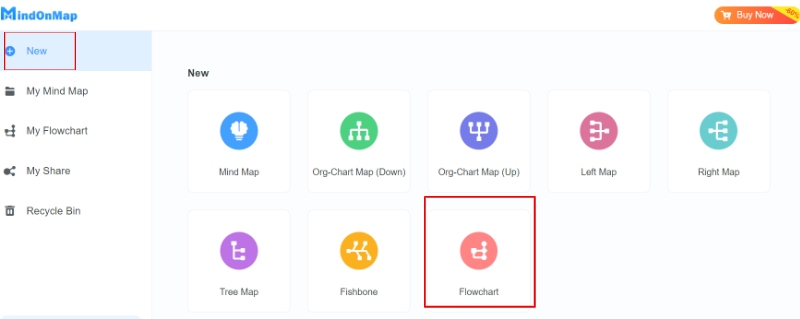
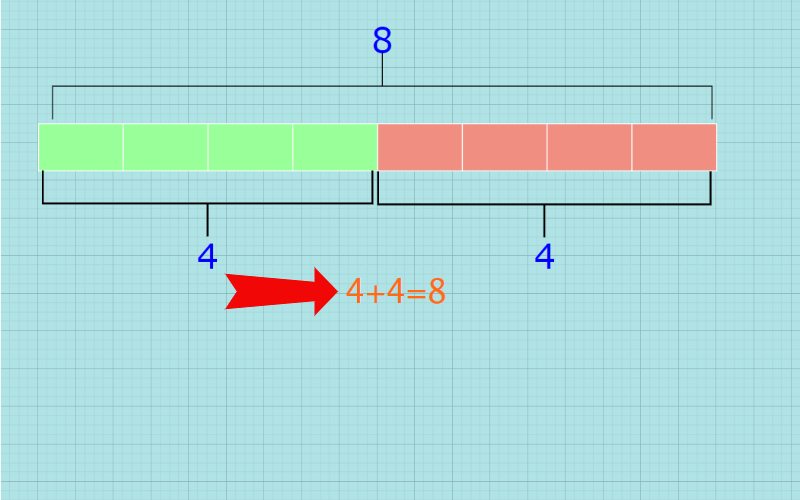
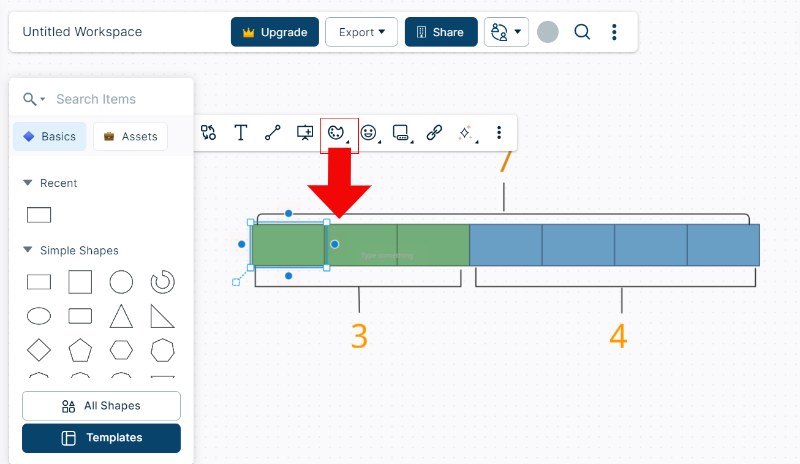
Toplam miktarı göstermek için büyük bir dikdörtgen veya çizgi seçin. Farklı parçaları göstermek için daha küçük bölümlere ayırın. Renkleri ve temaları değiştirebilirsiniz. Daha sonra ayırmak için parantez kullanabilirsiniz.
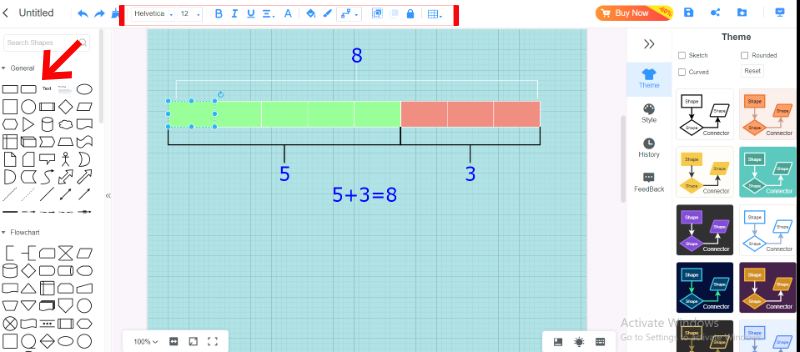
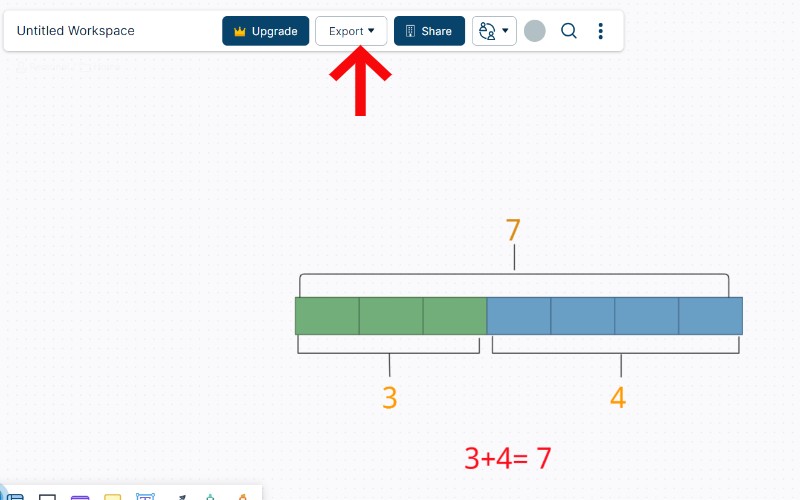
Verilerinizi etiketleyin ve bunları özetleyen bir formül oluşturun.
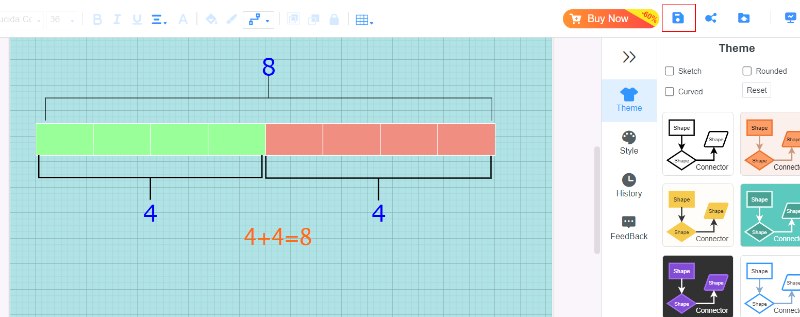
Tüm bilgileri ve olası düzeltmeleri inceledikten sonra projenizi kaydetmek için Kaydet düğmesine tıklayın.
Bölüm 4. 3 Diğer Araçla Bant Diyagramı Nasıl Yapılır
Bant diyagramı nasıl yapılır? Bant diyagramları, matematik problemlerini elde etmeyi ve çözmeyi kolaylaştıran süper yararlı görsel yardımcılardır. Sayıları dikdörtgenler veya çubuklar olarak gösterirler, şeylerin nasıl bağlandığını açıkça gösterir ve problem çözme sürecini basitleştirirler. Bu kılavuz, bant diyagramları yapmak için üç temel aracı inceleyecektir: EdrawMax Online, Creately ve Lucidchart. Her aracın özellikleri vardır, böylece ihtiyaçlarınıza uyan ve en çok beğendiğiniz aracı seçebilirsiniz. Bant diyagramları yaparak, problemleri çözmede ve matematik kavramlarını daha derinlemesine anlamada daha iyi hale geleceksiniz. Bant diyagramına atlayalım ve bu araçların neden harika olduğunu görelim.
Seçenek 1. EdrawMax Çevrimiçi
EdrawMax Online her türlü diyagramı yapmak için kullanışlı bir araçtır. Birçok farklı şablon, şekil ve bunları ayarlama yolları ile birlikte gelir. Sadece bant diyagramları için yapılmamış olsa da, birçok şeyi yapabilme yeteneği onu bu tür görsel kılavuzlar yapmak için iyi bir seçim haline getirir.
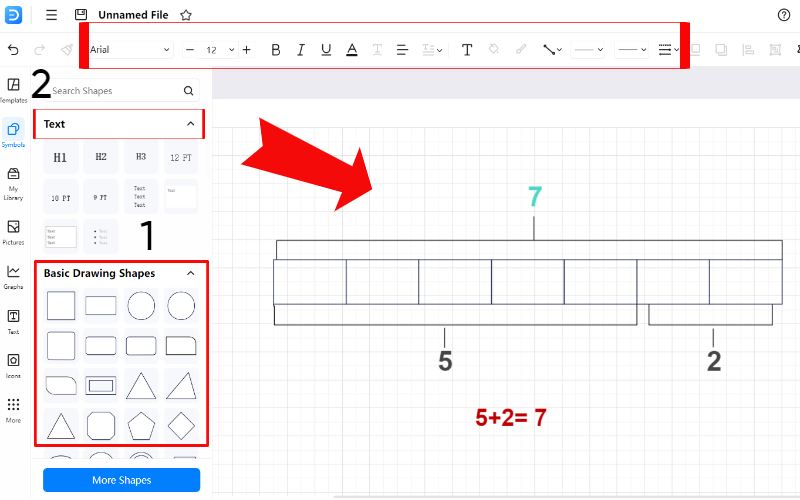
Aracı arayın ve yeni bir belge oluşturarak başlayın.
Bantı ve bölümlerini göstermek için şekil kütüphanesinden dikdörtgenler veya çizgiler seçin. Verileriniz için dikdörtgenleri doğru uzunluklarda yapmak için araçları kullanın. Bant diyagramının farklı bölümlerini işaretlemek için metin kutularını kullanın.
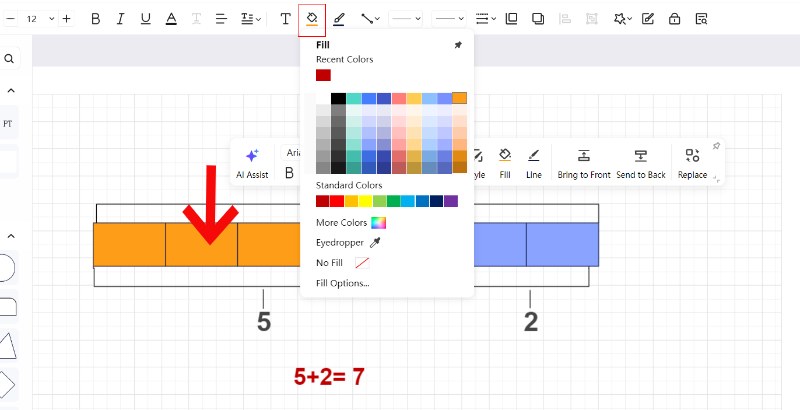
Bant diyagramınızı kendinize ait hale getirmek için renkleri, yazı tiplerini ve diğer öğeleri değiştirin.
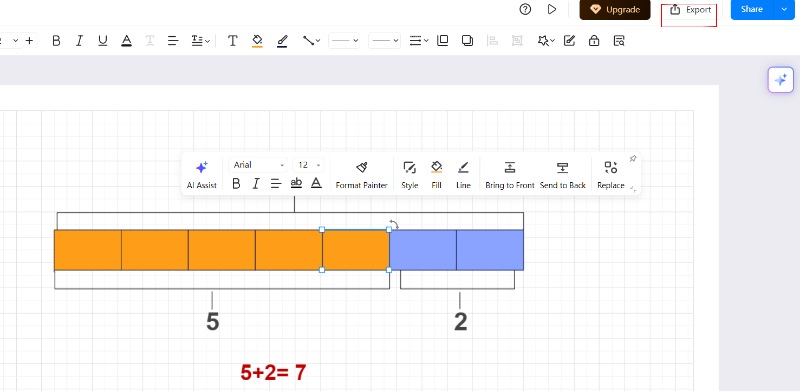
Bant diyagramınızdan memnunsanız çalışmanızı kaydedin.
Seçenek 2. Creately
Creately, birçok şablon, şekil ve özelleştirme seçeneğiyle güçlü bir çizim aracıdır. Sadece bant diyagramları için yapılmamış olsa da, esnekliği onu bu görsel haritaları oluşturmak için iyi bir uyum haline getirir.
Creately ile bant diyagramı yapma adımları
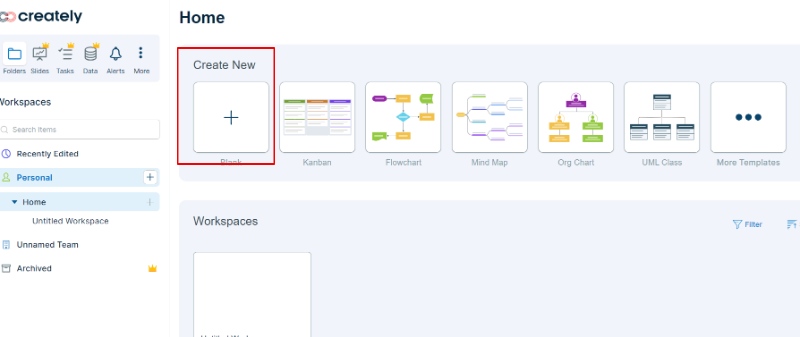
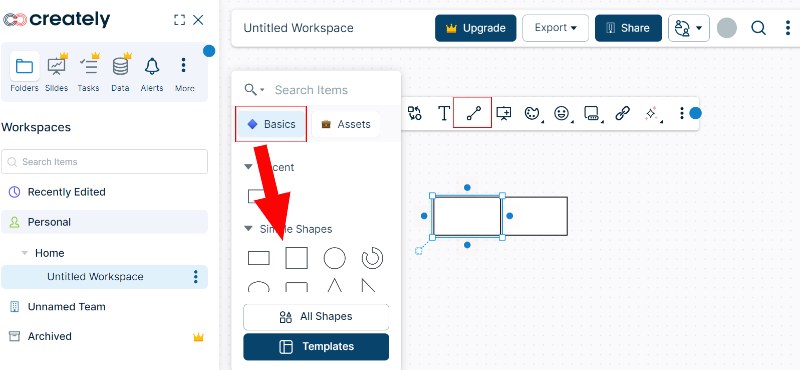
Creately web sitesine gidin ve bandı ve bölümlerini temsil eden basit bir dikdörtgen şekli ve bağlayıcı kullanarak bir diyagram oluşturun.
Dikdörtgenlerin uzunluklarını verilerinize uyacak şekilde ayarlamak için yeniden boyutlandırma araçlarını kullanın. Bant diyagramının farklı bölümlerini metin kutuları kullanarak etiketleyin.
Bant diyagramınızı kişiselleştirmek için renkleri, yazı tiplerini ve diğer görsel öğeleri değiştirin.
Artık bant diyagramınızı Creately'de kaydedebilirsiniz. Sadece Export'a tıklayın.
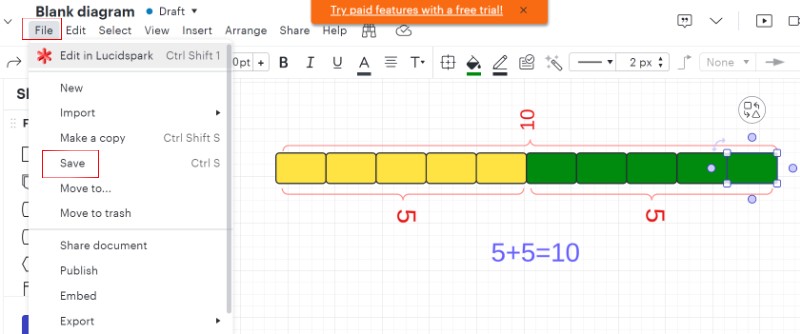
Seçenek 3. Lucidchart
Lucidchart, kullanımı kolay ve birçok harika özelliğe sahip, çok sevilen bir çizim aracıdır. Bant gibi her türlü diyagramı yapmak için birçok farklı şablon ve şekle sahiptir. İşte bant diyagramı nasıl çizilir.
Lucidchart'a gidin ve Google hesabınıza giriş yapın. Yeni'ye tıklayın ve Boş belge'yi seçin.

Akış Şeması ve Şekiller'deki şekilden, bandı ve bölümlerini temsil edecek dikdörtgenler veya çizgiler seçin.
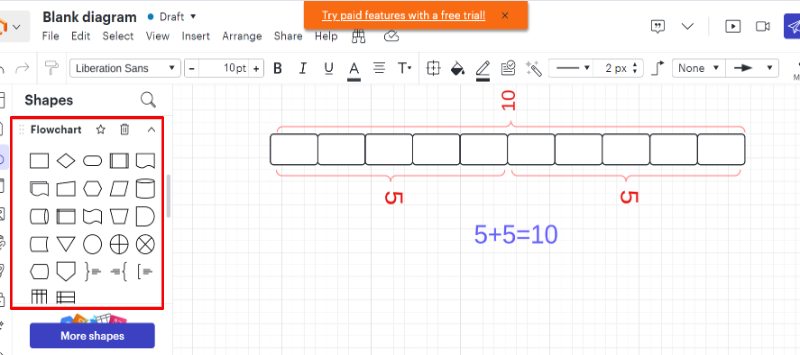
Dikdörtgenlerin uzunluklarını verilerinizle eşleşecek şekilde ayarlamak için yeniden boyutlandırma araçlarını kullanın. Ayrıca bant diyagramının farklı bölümlerini etiketlemek için metin kutuları da ekleyebilirsiniz.

Verilerinizi bölmek için bir renk doldurabilirsiniz. Çalışmanızı tamamladıktan sonra diyagramınızı Kaydedin veya Dışa Aktarın. Bunu Dosya şeridinde bulabilirsiniz.
Bölüm 5. Bant Diyagramı Nasıl Yapılır Hakkında SSS
Bant diyagramlarını kullanarak oranları nasıl çözersiniz?
Bant diyagramlarıyla oranları bulmak için, her oran numarası için çubuklar çizin, bunları orana göre eşit parçalara bölün ve işaretleyin. Sayılarınız aynı oranı koruyarak eksik olanı bulur ve oranın başladığınız problemle eşleştiğinden emin olun. Bant diyagramları, oranlarla ilgili problemleri görmeyi ve çözmeyi kolaylaştırır.
Bir bant diyagramını nasıl tanımlarsınız?
Bir bant diyagramı, sayıların ve bunların ilişkilerinin matematikte nasıl çalıştığını göstermek için kullanışlıdır. Sayıların nasıl birbirine bağlandığını göstermek için bölümlere ayrılmış bir dikdörtgen veya çubuktur. Çubuk modeli, şerit diyagramı, kesir şeridi veya uzunluk modeli olarak da adlandırılan bu model, özellikle kelimeler içeren her türlü matematik problemini ele almak için harikadır. Bunu bir sayı doğrusunun resmi gibi düşünün, ancak tam sayıları göstermek yerine, miktarları bölmenize veya farklı sayıları karşılaştırmanıza yardımcı olur.
3. sınıf matematikte diyagram nedir?
Matematikte, bir diyagram, bilgileri veya verileri anlaşılması kolay bir şekilde gösteren bir resim gibidir. Matematik kavramlarını öğrenmeyi çok daha kolay hale getiren görsel bir araçtır. 3. sınıftaki çocuklar için diyagramları birçok şekilde kullanabilirsiniz, örneğin Sayı doğruları: Bunlar sayıları sıraya koyan diyagramlardır. Çubuk grafikler: Bunlar, verileri göstermek için çubuklar kullanan diyagramlardır. Resimler: Matematik problemlerini çözmenize yardımcı olması için resimler çizebilirsiniz. Modeller: Matematik fikirlerini göstermek için şeyler veya çizimler kullanabilirsiniz. Diyagramlar, matematik problemlerini daha net görmenizi ve daha basit hale getirmenizi sağlar.
Çözüm
Kısacası, bu tamamen şu anlama geliyor: bant diyagramı nasıl çizilir. Nerede kullanırsanız kullanın, bant diyagramları matematik problemlerini görmenin ve çözmenin kullanışlı ve iyi bir yoludur, bu nedenle öğrenciler, öğretmenler ve karmaşık şeyleri anlamayı kolaylaştırmaya çalışan herkes için oldukça faydalıdır.