2 sätt att göra en värdeströmskarta
Processförenkling är avgörande för framgång och effektivitetsoptimering. Den processen är möjlig när vi använder en ordentlig mappning för det. I linje med det är värdeströmskartläggning en potent metod som används inom många olika områden, såsom teknik och användarupplevelse känd som UX. Det gör det möjligt för experter att undersöka och effektivisera hela uppsättningen av processer som behövs för att ge kunderna en vara eller tjänst.
I samband med det kommer vi att fördjupa oss i detaljerna kring värdeströmskartläggning. I denna expertdrivna guideartikel kommer vi att erbjuda dig omfattande tillvägagångssätt, användbara tips och en omedelbar steg-för-steg-guide som hjälper dig med skapa en värdeströmskarta med hjälp av ett onlineverktyg och ett Microsoft-verktyg.

- Del 1. Hur man skapar värdeströmskarta online
- Del 2. Hur skapar man VSM i Excel?
- Del 3. Vanliga frågor om hur man skapar en värdeströmskarta
Del 1. Hur man skapar värdeströmskarta online
Value Stream Mapping, eller VSM, görs enklare med MindOnMap. Detta fantastiska onlineverktyg gör det lättare att visualisera och analysera arbetsflöden för att hitta ineffektivitet och utvecklingsmöjligheter. Mer än så, MindOnMap har funktioner för lättanvänd dra-och-släpp-kartskapande, redigerbara mallar, teamanpassning i realtid via samarbete, integrerad dataanalys för välinformerat beslutsfattande och smidiga exportalternativ i PNG- och PDF-format är några av nyckelfunktionerna. Dessutom möjliggör dessa kraftfulla funktioner i MindOnMap effektiv kartläggning, bedömning och optimering av värdeflöden, vilket förbättrar operativ effektivitet och affärsresultat.
Med det, låt oss nu bevisa dessa funktioner som den erbjuder genom att använda dem i denna enkla och snabba riktlinje för att skapa en värdeströmskarta online gratis.
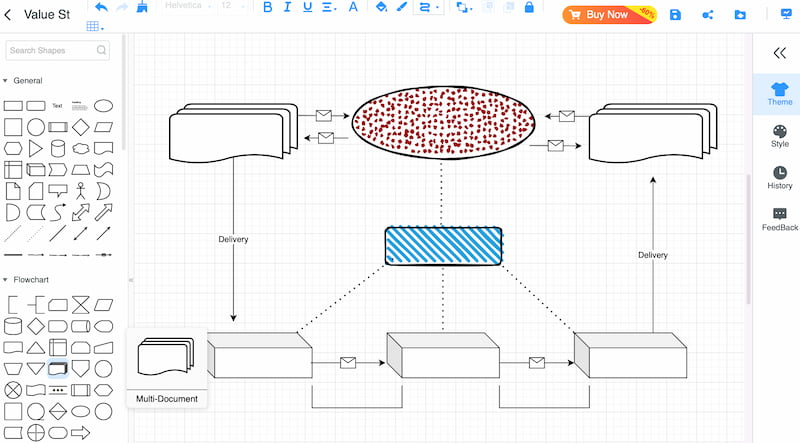
På din PC, använd MindOnMap-verktyget. Efter det, välj Flödesschema genom att klicka på ikonen Ny.

Du kommer nu att guidas till verktygets arbetsyta av den. Här kan du skapa den nödvändiga värdeströmskartan genom att använda det omfattande utbudet av former. Beroende på vilken typ av karta du gör kan du inkludera så många formulär du vill.
Det är dags att märka varje form med text för att lägga till extra information till flödesschemat efter att du har placerat alla former du behöver på lämpliga platser. Glöm inte att ta med alla detaljer för att säkerställa att presentationen och rapporterna fungerar bra.
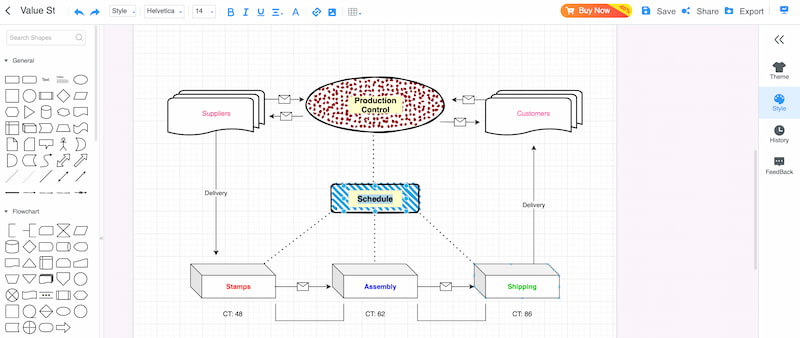
Vi kommer nu att ändra teman och stilar för att avsluta värdeströmskartan. Spara sedan din karta nu.
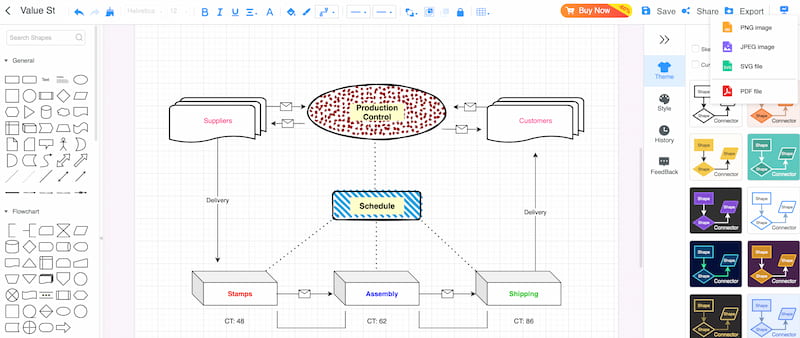
Använder MindOnMap för att skapa ett flödesschema online, såsom Value Stream Map, är verkligen enkel och effektiv. På grund av processens användarvänliga design är det enkelt att skapa utmärkta kartor. Funktionerna som har diskuterats är äkta, helt fungerande och ger verkligt värde utan några extra avgifter. De kraftfulla funktionerna och det användarvänliga gränssnittet i MindOnMap garanterar att kartorna du skapar är korrekta och presenteras på ett polerat sätt.
Mer än så är den här applikationen ett pålitligt och användbart alternativ för alla som vill förbättra sina processanalyser och förbättringsinsatser eftersom det ger dig möjligheten att använda avancerad funktionalitet och realtidskommunikation gratis.
Säker nedladdning
Säker nedladdning
Del 2. Hur skapar man VSM i Excel?
Varje organisation som vill förbättra effektiviteten och effektivisera processer för sina tjänster eller system måste först skapa en värdeströmskarta. Som vi alla vet kan värdeströmskartläggning med program som Microsoft Excel vara ett flexibelt och prisvärt alternativ i dagens hektiska affärsvärld. Med sin välkända design och omfattande funktionsuppsättning gör Excel det enkelt att se och analysera arbetsflöden, upptäcka flaskhalsar och optimera processer.
I samband med det kommer den här handledningen att visa dig hur du skapar en värdeströmskarta i Excel steg-för-steg så att du kan använda dess kraft för att öka operativ effektivitet och uppnå dina mål. Om du är ny på värdeströmskartläggning eller vill fräscha upp dina kunskaper, kommer den här artikeln att ge dig de grundläggande metoderna och råden du behöver för att komma igång.
Öppna Excel på din dator och klicka på Skapa för att lägga till ett nytt kalkylblad.
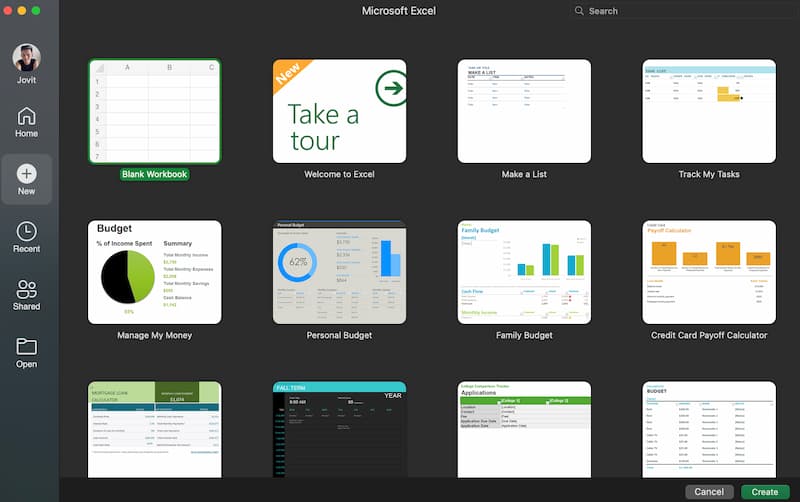
Nästa sak vi behöver göra är att lägga till graferna eller diagrammen som vi behöver genom att använda Gränser drag. Du kan lägga till diagram så mycket du vill så länge det är nödvändigt för flödet av värdeströmmen du skapar.
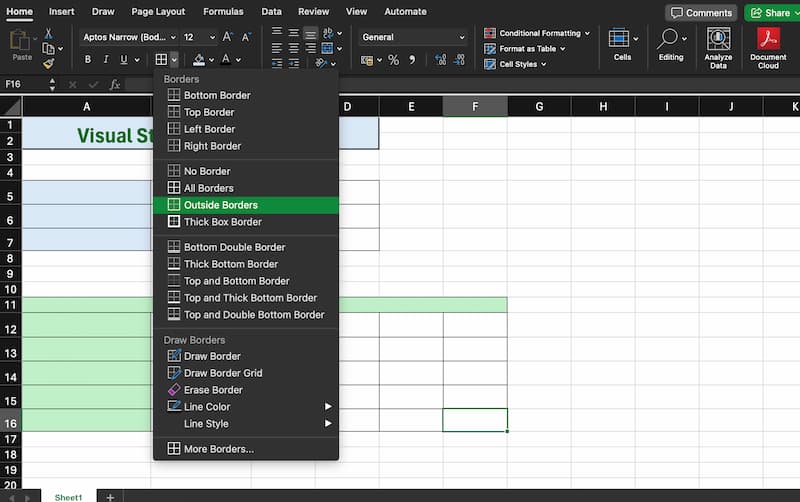
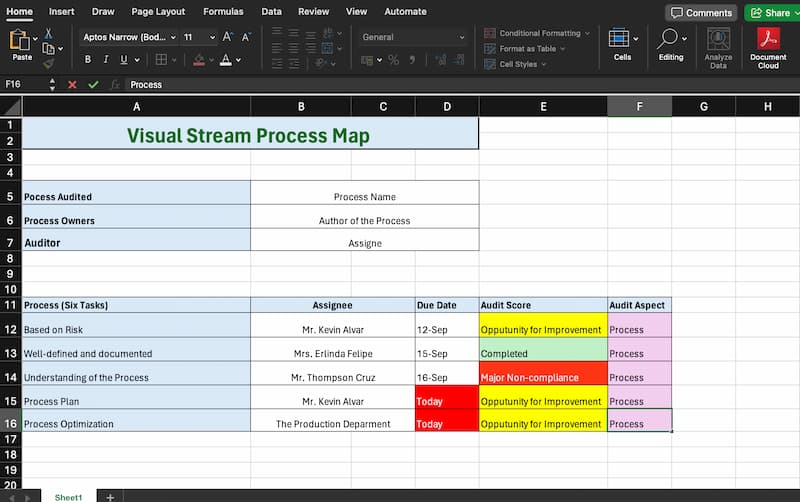
För närvarande lägger du till en etikett på diagrammen du har lagt till. Vänligen lägg till text till varje diagram efter processen du behöver för din Value Stream-karta.
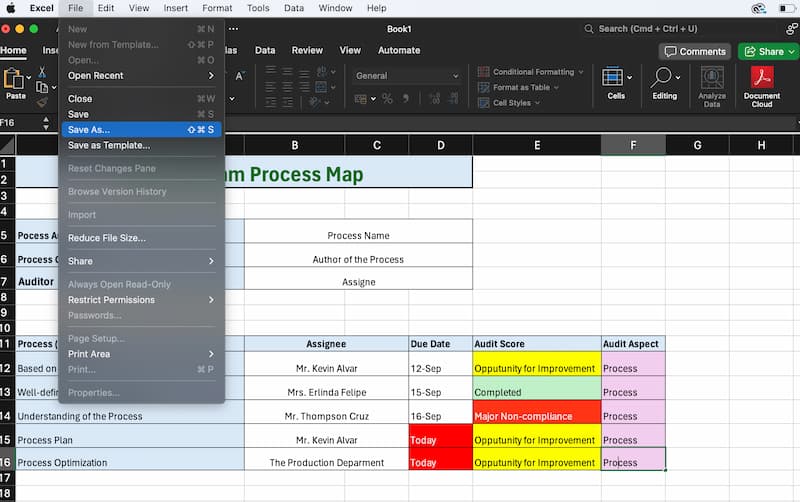
När du är nöjd med värdeflödeskartan sparar du ditt Excel-kalkylblad. Du kan också exportera kartan som en PDF- eller bildfil för enklare delning och presentation. För att exportera, gå till Fil menyn, välj Spara som, och välj önskat format.
Genom att följa dessa steg kan du använda Excel för att skapa ett flödesschema, till exempel en värdeströmskarta, som är lätt att förstå och användbar för att utvärdera och förbättra din verksamhet. På grund av Excels flexibilitet kan du anpassa det i detalj och se till att varje komponent i din värdeström är tydligt avbildad och enkel att förstå.
Slutligen ger dessa procedurer dig en omfattande förståelse för hur du använder Excel för att skapa en värdeflödeskarta, som kan hjälpa dig att analysera arbetsflöden, lokalisera ineffektivitet och främja förbättringar. Att få en grundlig förståelse för din verksamhet genom att behärska denna metod kommer att göra det möjligt för dig att optimera arbetsflöden och förbättra företagets resultat.
Del 3. Vanliga frågor om hur man skapar en värdeströmskarta
Kan du skapa en värdeströmskarta på egen hand?
Genom att sammanställa information om processen, inklusive alla steg, ingångar och utgångar, kan du faktiskt göra en värdeströmskarta på egen hand. Efter det kommer du att använda dessa data för att skapa en visuell skildring av proceduren som framhäver både aktiviteter som ger värde och de som inte gör det. Bra att du kan använda guiderna ovan för att hjälpa till med processen.
Vilka är stegen för att skapa en värdeströmskarta?
Det första steget i att skapa en värdeströmskarta är att identifiera och definiera den process som du vill kartlägga. Efter att ha samlat information om det aktuella tillståndet, inklusive mätvärden relaterade till varje processsteg, skapa en karta över det aktuella tillståndet. Undersök denna karta för att identifiera eventuella ineffektiviteter, gör en karta över det framtida tillståndet med de föreslagna förbättringarna och utarbeta en handlingsplan för att omsätta dessa förändringar i praktiken. Alla dessa ges ovan.
Vilken programvara används för värdeströmskartläggning?
Programvara som Microsoft Excel och Visio, som tillhandahåller specifika mallar för att göra detaljerade kartor, kan användas för att utföra värdeströmskartläggning. Andra applikationer med användarvänliga gränssnitt och samarbetsfunktioner i realtid inkluderar MindOnMap. Vidare finns specialistprogram för processmodellering och ständiga förbättringar tillgängliga, såsom LeanKit och iGrafx.
Hur kan värdeströmskartläggning förbättra operativ effektivitet?
Genom att erbjuda en noggrann visuell skildring av en process, ökar värdeströmskartläggning den operativa effektiviteten genom att hjälpa till med identifiering och eliminering av avfall, förkorta cykeltider och effektivisera arbetsflöden. Organisationer kan förbättra produktiviteten och övergripande prestanda genom att undersöka det nuvarande tillståndet och skapa en framtida tillståndskarta med riktade förbättringar.
Vilka typiska fel bör du undvika när du gör en värdeströmskarta?
När man utvecklar en värdeströmskarta inkluderar vanliga fel att inte inkludera gruppmedlemmar med processexpertis, missa viktiga processsteg och misslyckas med att samla in korrekt och heltäckande data. Dessutom kan användning av föråldrade eller misslyckade förbättringstekniker bli resultatet av att kartan inte uppdateras regelbundet för att ta hänsyn till processändringar.
Varför är en värdeströmskarta viktig och vad innebär den?
En värdeströmskarta är ett diagram som visar processerna i en process från början till slut, och betonar både åtgärder som bidrar med värde och de som inte gör det. Det är betydelsefullt eftersom det, genom att ge en heltäckande bild av processflöden och flaskhalsar, hjälper företag att identifiera ineffektivitet, effektivisera processer och öka den totala produktiviteten.
Slutsats
Sammanfattningsvis ger MindOnMap och Excel starka verktyg för att utveckla effektiva värdeflödeskartor, som var och en uppfyller kraven och preferenserna från olika användare. Excel erbjuder en bekväm och anpassningsbar miljö som låter dig anpassa och hantera varje del av din karta i detalj. Å andra sidan är MindOnMap perfekt för team och mer komplexa kartläggningskrav eftersom det ger en intuitiv webbplattform med värdeströmskartläggningsspecifika funktioner som integrerad dataanalys och realtidssamarbete. Oavsett om du väljer MindOnMap för dess sofistikerade funktioner eller Excel för dess anpassningsförmåga, kommer att bli skicklig med dessa verktyg att ge dig verktygen för att effektivisera dina processer och mer framgångsrikt uppfylla dina företagsmål.