වැරදි ගස් විශ්ලේෂණය පැහැදිලි කර ඇත: සෑම කෙනෙකුටම සරල උදාහරණ
Fault Tree Analysis (FTA) යනු විය හැකි පද්ධති බිඳවැටීම් සහ ඒවාට හේතු වන දේ සොයා ගැනීමට සහ ලබා ගැනීමට මාර්ගයකි. එය පද්ධතියේ අසාර්ථක මාර්ග පෙන්වීමට රූප සටහන් භාවිතා කරයි. සෑම මට්ටමක්ම විභව හේතු දක්වයි. ගුවන් සේවා, න්යෂ්ටික බලශක්ති සහ සෞඛ්ය සේවා වැනි තීරණාත්මක අංශවල FTA අදාළ වේ. එය රසායනික, මෝටර් රථ, ආරක්ෂක සහ තාක්ෂණික අංශ ද ආවරණය කරයි. මෙම ප්රදේශවල ආරක්ෂාව සහ විශ්වසනීයත්වය ඉතා වැදගත් වේ. පද්ධතිය බිඳ දැමිය හැකි විවේචනාත්මක අසාර්ථකත්වයන් සොයා ගැනීම එහි අරමුණයි. එය පසුව මෙම අසාර්ථකත්වයන් ඒවායේ හේතු සහ බරපතලකම සොයා ගැනීමට ඒවායේ මූලාරම්භය වෙත යොමු කරයි. FTA මගින් තීක්ෂ්ණ බුද්ධිය ලබා දිය හැක. ඒවා අසාර්ථක වීම වළක්වා ගැනීමට සහ පද්ධතියේ විශ්වසනීයත්වය වැඩි දියුණු කිරීමට උපකාරී වේ. මේ වැරදි ගස් විශ්ලේෂණය උදාහරණය පද්ධතිවල ආරක්ෂාව සහ විශ්වසනීයත්වය හඳුනා ගැනීමට, අවම කිරීමට සහ සහතික කිරීමට ක්රමානුකූල ප්රවේශයක් ඉදිරිපත් කරයි.

- 1 කොටස. හොඳම වැරදි ගස් විශ්ලේෂණ ප්රස්තාර සාදන්නා: MindOnMap
- 2 කොටස. වැරදි ගස් විශ්ලේෂණය උදාහරණය
- 3 කොටස. වැරදි ගස් විශ්ලේෂණ සැකිල්ල
- 4 වන කොටස. වැරදි ගස් විශ්ලේෂණ උදාහරණ අච්චුව පිළිබඳ නිතර අසන ප්රශ්න
1 කොටස. හොඳම වැරදි ගස් විශ්ලේෂණ ප්රස්තාර සාදන්නා: MindOnMap
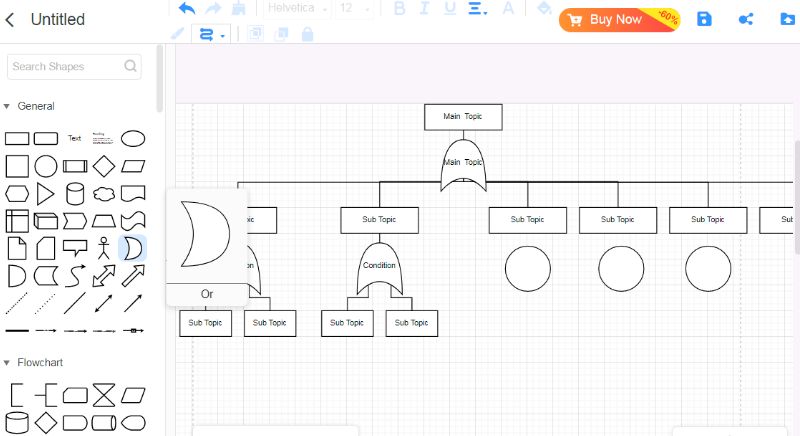
MindOnMap යනු මොළය අවුල් කිරීමට සහ වැරදි ගස් විශ්ලේෂණ සැකිලි කිරීමට උපකාරී මෙවලමකි. වැරදි විය හැකි දේ සොයා ගැනීමට උත්සාහ කරන විටද මෙම යෙදුම අදාළ වේ. එය භාවිතා කිරීමට ඇත්තෙන්ම පහසු වන අතර විවිධ දේවල් එකිනෙකට බලපාන ආකාරය බැලීමට ඔබට උපකාර කරයි. ඔබ විය හැකි ගැටළු සොයා ගැනීමට උත්සාහ කරන්නේ නම්, MindOnMap ආරම්භ කිරීමට හොඳ ස්ථානයකි.
ප්රධාන කරුණු:
• MindOnMap විභව අසාර්ථක ස්ථාන නිදර්ශනය කරන දෝෂ සහිත ගස් සඳහා සරල කළ රූප සටහන් නිර්මාණය.
• මෙම රූප සටහන් සාම්ප්රදායික ගැටළු විසඳීමේ ප්රවේශය සමඟ පෙලගැසී ස්ථර වල ව්යුහගත කළ හැක.
• එය ද නම්යශීලී වන අතර, ඔබට පෙනුම රිසිකරණය කිරීමට ඉඩ සලසයි.
• සියලු දෙනාම එකම රූප සටහනක් මත එකවර වැඩ කිරීමත් සමඟ කණ්ඩායම් සහයෝගීතාව හැකි ය.
• බෙදාගැනීම හෝ අනාගත යොමු කිරීම සඳහා ඔබට විවිධ ආකෘතිවලින් නිමි රූප සටහන් සුරැකිය හැක.
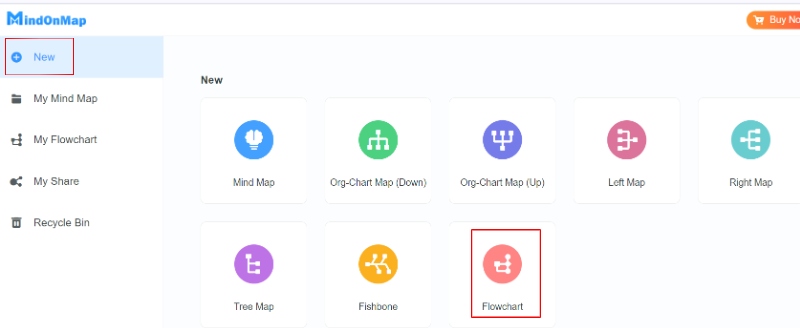
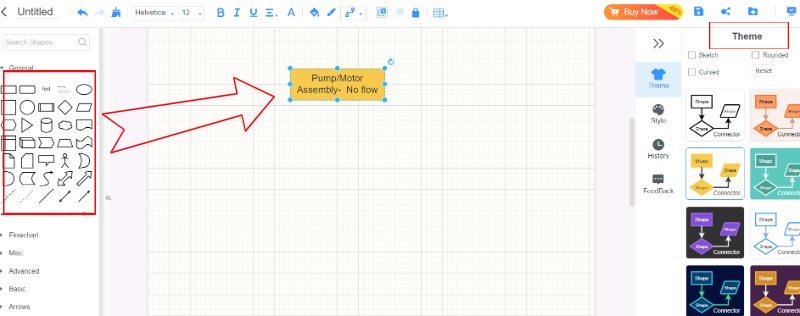
ඔබ දැනටමත් ඇතුළු වී ඇත්නම් ලොග් වන්න. එසේ නොවේ නම්, නව ගිණුමක් සාදන්න. නව ව්යාපෘතියක් ආරම්භ කිරීමට උපකරණ පුවරුවේ නව ව්යාපෘති බොත්තම ඔබන්න.
ඔබ විමර්ශනය කරන ප්රධාන සිදුවීම හෝ පද්ධති අසාර්ථකත්වය ප්රධාන නෝඩය පෙන්වීමෙන් ආරම්භ කරන්න. ප්රධාන සිදුවීම සඳහා ඔබේ ප්රධාන නෝඩයට පැහැදිලි නමක් දෙන්න. ඔබට ඔබේ හැඩතල සහ තේමාවන් ද තෝරා ගත හැකිය.
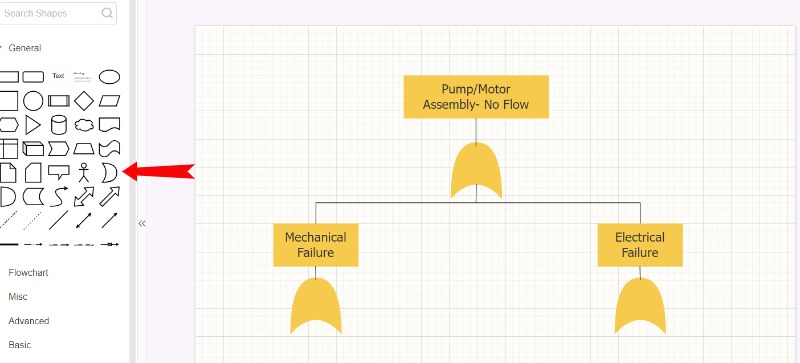
ප්රධාන නෝඩයෙන් ඉවත් වන කුඩා නෝඩ් එක් කරන්න. මේවා මූලික සිදුවීම් හෝ ප්රධාන සිදුවීමට හේතු විය හැකි ප්රධාන හේතු වේ. සෑම මූලික සිද්ධි නෝඩයක්ම එය කුමක් ගැනද යන්න විස්තර කිරීමට හොඳින් නම් කර ඇති බවට සහතික වන්න.
සමහර සිදුවීම් අනෙක් ඒවා මත රඳා පවතී නම්, මෙම සම්බන්ධතා පෙන්වීමට මැද නෝඩ් එක් කරන්න. නෝඩ් අතර AND සහ OR සම්බන්ධතා පෙන්වීමට සංකේත හෝ වචන භාවිතා කරන්න. ප්රධාන සිදුවීම සඳහා සියලුම සම්බන්ධිත සිදුවීම් සිදුවිය යුතු බව පෙන්වන්න, සහ සම්බන්ධිත ඕනෑම සිදුවීමක් ප්රධාන සිදුවීමට මඟ පෑදිය හැකි බව පෙන්වන්න.
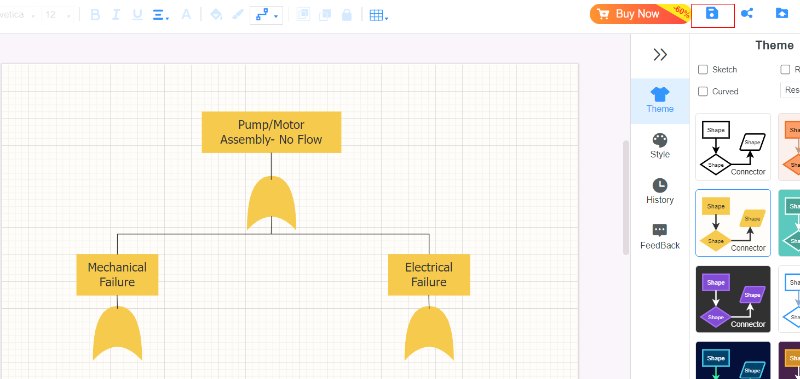
මූලික සිදුවීම්වල සිට ප්රධාන සිදුවීම් ප්රවාහය දක්වා ඇති පියවර අර්ථවත් බව සහතික කර ගනිමින්, එය තේරුම් ගැනීමට පහසු වන සේ ඔබේ දෝෂ ගස සකසන්න. ඒවා කැපී පෙනෙන ලෙස නෝඩ් සහ සම්බන්ධතා පෙනුම වෙනස් කරන්න.
ඔබේ වැරදි ගස ඔබ කැමති ආකෘතියකින් සුරකින්න (PDF හෝ රූපය වැනි). ඔබේ විශ්ලේෂණයට සහාය වීම සඳහා ඔබේ ව්යාපෘති වාර්තා හෝ ඉදිරිපත් කිරීම්වලට ඔබේ වැරදි ගස එක් කරන්න.
2 කොටස. වැරදි ගස් විශ්ලේෂණය උදාහරණය
ඔබට පැහැදිලිව අවබෝධ කර ගැනීම සඳහා දෝෂ ගස් විශ්ලේෂණය සඳහා උදාහරණ කිහිපයක් මෙන්න.
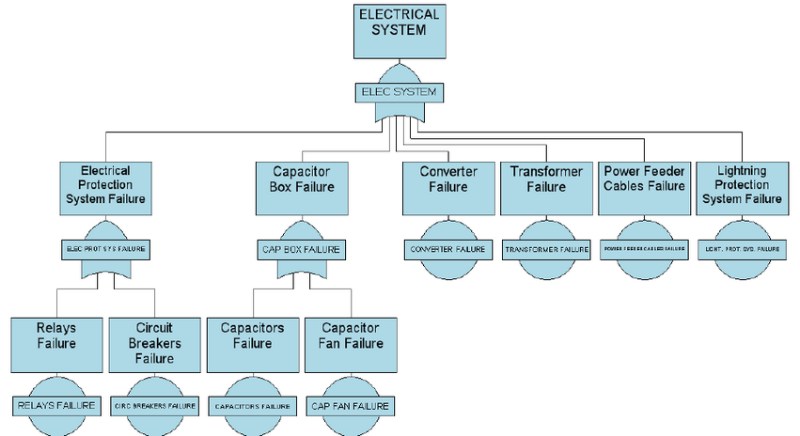
උදාහරණ 1. වැරදි ගස් විශ්ලේෂණය උදාහරණ: විදුලි පද්ධතිය
පැහැදිලි කිරීම:
• ඉහළම සිදුවීම: විදුලි බුබුල දැල්වෙන්නේ නැත
○ මූලික සිදුවීම 1: බලශක්ති ප්රභවයේ අසාර්ථකත්වය
○ මූලික සිදුවීම 2: ස්විචය අසාර්ථක වීම
○ මූලික සිදුවීම 3: රැහැන් අසමත් වීම
○ මූලික සිදුවීම 4: වයර් කැඩීම
○ මූලික සිදුවීම 5: ලිහිල් සම්බන්ධතාවය
වැරදුන ප්රධානම දේ තමයි බල්බය පත්තු නොවීම. මෙයට හේතු විය හැකි අනෙක් දේවල් (බලය ක්රියා නොකිරීම, ස්විචය ක්රියා නොකිරීම හෝ වයර් නිවැරදිව සම්බන්ධ නොවීම වැනි) ප්රධාන ගැටලුවට හේතු විය හැකිය. මූලික ගැටළු (කැඩුණු වයරයක් හෝ ලිහිල් සම්බන්ධතාවයක් වැනි) ආලෝක බල්බය ක්රියා නොකිරීමට හේතු විය හැකි සරලම ගැටළු වේ. මෙම පින්තූරයේ දැක්වෙන්නේ විදුලි බුබුල දැල්වීමට නොහැකි වීමට හේතු විය හැකි සියලු හේතු, සමස්ත පද්ධතිය කෙතරම් විශ්වාසදායකදැයි පරීක්ෂා කිරීම පහසු කරවයි.
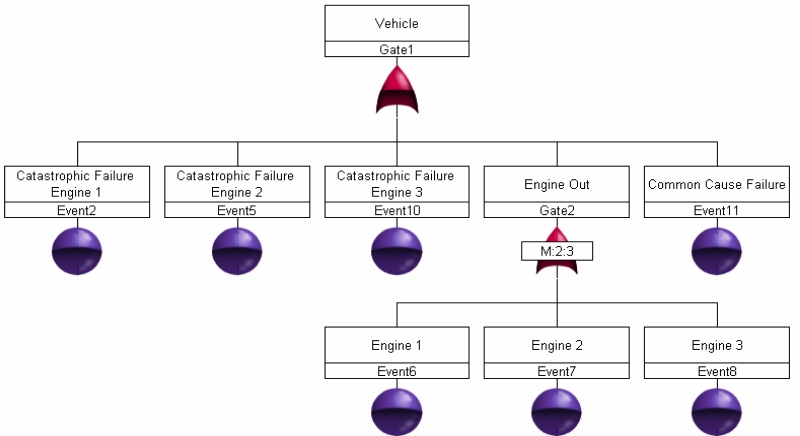
උදාහරණය 2. දෝෂ සහිත ගස් විශ්ලේෂණය නියැදිය: අභ්යවකාශ යානා දියත් කිරීමේ පද්ධතිය
පැහැදිලි කිරීම:
• ඉහළම සිදුවීම: අසාර්ථක දියත් කිරීම
○ අතරමැදි සිදුවීම 1: රොකට් අසාර්ථක වීම
◆ මූලික සිදුවීම 1: එන්ජිම අසමත් වීම
◆ මූලික සිදුවීම 2: ව්යුහාත්මක අසාර්ථකත්වය
○ අතරමැදි සිදුවීම 2: දියත් කිරීමේ පෑඩ් අසමත් වීම
◆ මූලික සිදුවීම 3: බිම් පාලන අසමත් වීම
◆ මූලික සිදුවීම 4: සන්නිවේදන පද්ධතියේ අසාර්ථකත්වය
ප්රධාන සිදුවීම වන්නේ අනවශ්ය ප්රතිඵලයයි: අසාර්ථක දියත් කිරීම. ද්විතියික සිදුවීම් වලට අදහස් කරන පරිදි ක්රියා නොකළ හැකි තීරණාත්මක සංරචක හෝ කොටස් ඇතුළත් වේ. මූලික සිදුවීම් යනු එක් එක් සංරචකයේ හෝ කොටසෙහි සිදුවන මූලික බිඳවැටීම් වේ. මෙම රූප සටහන මඟින් අසාර්ථක අභ්යවකාශ යානයක් දියත් කිරීමට ඇති විය හැකි හේතු ගෙනහැර දක්වන අතර, පද්ධතියේ විශ්වසනීයත්වය සහ ආරක්ෂාව පිළිබඳ සවිස්තරාත්මක විශ්ලේෂණයක් කිරීමට ඉඩ සලසයි.
3 කොටස. වැරදි ගස් විශ්ලේෂණ සැකිල්ල
Fault Tree Diagram සැකිල්ලක් සංකීර්ණ පද්ධතිවල ඇති විය හැකි අසාර්ථකත්වයන් පරීක්ෂා කිරීමට ව්යුහගත මාර්ගයක් ඉදිරිපත් කරයි. එයට පෙර සාදන ලද සංරචක සහ සංකේත ඇතුළත් වේ. මේවා ක්රියාවලිය කාර්යක්ෂම, ස්ථාවර, පැහැදිලි සහ නම්යශීලී කිරීමට උපකාරී වේ. පොදු මූලද්රව්යවලට ඉහළ සිදුවීම්, මූලික සිදුවීම්, අතරමැදි සිදුවීම්, දොරටු සහ සංකේත ඇතුළත් වේ. මෙම සැකිලි අසාර්ථක ස්ථාන හඳුනා ගැනීමට, අවදානම් තක්සේරු කිරීමට සහ පද්ධති ආරක්ෂාව වැඩි කිරීමට උපකාරී වේ.
MindOnMap සමඟින් සාදන ලද Fault Tree Diagram උදාහරණ අච්චුව
පරිපථය ක්රියා කිරීම නැවැත්වීම වැනි මූලික ගැටළු. කොටස් අසමත් වීම (බල ඒකකය, ස්විචය, වයර්, ආදිය) ප්රධාන කොටස් අසමත් වීම (කෙටි, විවෘත හෝ කැඩුණු කොටස් වැනි). සිදුවීම් සම්බන්ධ වන ආකාරය පෙන්වීමට තාර්කික මෙවලම්. කොටස් සහ ඒවායේ සම්බන්ධතා සඳහා පින්තූර හෝ සංඥා.
සැකිල්ල භාවිතා කරමින්:
ප්රධාන ගැටළුව සඳහන් කිරීමෙන් ආරම්භ කරන්න. ප්රධාන ප්රශ්නය කුඩා කොටස් වලට වෙන් කර එක් එක් විය හැකි දේ ගැන සිතන්න. මැද කොටස් අසාර්ථක වීමට හේතු වන ප්රධාන ගැටළු සොයා ගන්න. මෙම කොටස් සම්බන්ධ වන ආකාරය පෙන්වීමට තාර්කික මෙවලම් භාවිතා කරන්න. කොටස් සහ ගැටළු එකතු කිරීමෙන් හෝ ඉවත් කිරීමෙන් ඔබේ පරිපථයට ගැලපෙන අච්චුව සාදන්න.
සැකිල්ලක් භාවිතා කිරීම ප්රයෝජනවත් වේ:
• එය පැහැදිලි සැලැස්මක් තිබීමෙන් දේවල් වඩාත් කාර්යක්ෂම කරයි.
• එය ගැටළු වඩා හොඳින් තේරුම් ගැනීමට උපකාරී වේ.
• එය දේවල් ස්ථාවරව තබා ගනී.
• එය ඔබගේ නිශ්චිත අවශ්යතා වලට ගැලපේ.
4 කොටස. Fault Tree Analysis Example Template ගැන නිතර අසන ප්රශ්න
වැරදි ගස් විශ්ලේෂණයක් (FTA) ලිවීමේ පියවර මොනවාද?
දෝෂ සහිත ගස් විශ්ලේෂණයක් නිර්මාණය කිරීම, සිදුවිය හැකි අසාර්ථකත්වයන් සහ ඒවායේ හේතු හඳුනා ගැනීමට පියවර සංවිධානය කිරීම ඇතුළත් වේ. මෙන්න සාරාංශයක්:
1. ප්රධාන අසාර්ථකත්වය, එහි ප්රධාන හේතුව සහ ඕනෑම පහළ මට්ටමේ හේතු හඳුනා ගන්න.
2. AND හෝ OR වැනි තාර්කික කොන්දේසි භාවිතයෙන් මෙම අසාර්ථකත්වයන් සම්බන්ධ කරන්න.
3. ගස පහසුවෙන් තේරුම් ගැනීමට දෘශ්ය සංකේත භාවිතා කරන්න.
4. විශ්ලේෂණය නිවැරදිව පද්ධතියේ සැලසුම් සහ අසාර්ථක වීමේ හැකියාව පිළිබිඹු කරන බව තහවුරු කරන්න.
5. එක් එක් කොටස පැහැදිලි කරමින් වැරදි ගස කෙටියෙන් සාරාංශ කරන්න.
ඔබ වර්ඩ් හි වැරදි ගස් විශ්ලේෂණයක් නිර්මාණය කරන්නේ කෙසේද?
Word හි මූලික දෝෂ ගසක් සෑදීමට, මෙම පියවර අනුගමනය කරන්න:
1. නව හිස් ලේඛනයක් විවෘත කරන්න.
2. සෘජුකෝණාස්ර වැනි සිදුවීම් හැඩ සහ දියමන්ති වැනි ගේට්ටු හැඩ එකතු කිරීමට ඇඳීම් මෙවලම් භාවිත කරන්න.
3. මෙම හැඩතල ඒවායේ සම්බන්ධතා පෙන්වන රේඛා හෝ ඊතල සමඟ සම්බන්ධ කරන්න.
4. හැඩතල ලේබල් කිරීමට පෙළ කොටු එකතු කරන්න.
5. අකුරු, වර්ණ සහ පිරිසැලසුම භාවිතයෙන් දෝෂ සහිත ගසේ පෙනුම අභිරුචිකරණය කරන්න.
දෝෂ සහිත ගස් විශ්ලේෂණයක සරල උදාහරණයක් කුමක්ද?
ගෘහ විදුලි පරිපථයකට උදාහරණයක් වන්නේ විදුලි බුබුල දැල්වෙන්නේ නැති විටය. විය හැකි ගැටළු බල ප්රභවය, ස්විචය හෝ රැහැන් ගැටළුවක් විය හැකිය. රැහැන්ගත ගැටළු Wire break හෝ Loose connection විය හැක. දෝෂ සහිත ගසක් මෙම පියවර පෙන්වයි, විදුලි බුබුල ක්රියා නොකරන්නේ මන්දැයි සොයා ගැනීමට උපකාරී වේ.
නිගමනය
දෝෂ සහිත ගස් විශ්ලේෂණ අච්චුවකි සංකීර්ණ පද්ධතිවල ඇති විය හැකි ගැටළු සොයා ගැනීමට අවශ්ය වේ. එය එක් දෙයක් තවත් දෙයකට ගෙන යා හැකි ආකාරය පෙන්වීමට පින්තූර භාවිතා කරයි, අවදානම් හඳුනා ගැනීමට, ඒවා අඩු කිරීමට සහ ඔවුන්ගේ පද්ධති ශක්තිමත් කිරීමට සැලසුම් කිරීමට සමාගම්වලට උපකාර කරයි. හොඳ FTA සැකිලි සෑදීමට ඔබට විශේෂ මෘදුකාංගයක් භාවිතා කිරීමට හෝ MindOnMap වැනි මෙවලම් සමඟ අතින් එය කළ හැකිය. එය දේවල් විශ්ලේෂණය කිරීම පහසු කරන අතර සෑම අවස්ථාවකදීම ඔබට එකම ප්රතිඵල ලබා ගැනීම සහතික කරයි. FTA හි මූලික කරුණු ඉගෙන ගැනීමෙන් සහ නිවැරදි මෙවලම් තෝරාගැනීමෙන්, පුද්ගලයන්ට සහ කණ්ඩායම්වලට ගැඹුරු FTA පරීක්ෂාවන් සිදු කළ හැකිය, එය පද්ධති ආරක්ෂිත කිරීමට සහ වඩා හොඳින් ක්රියා කිරීමට උපකාරී වේ.