ឧទាហរណ៏នៃការគូសផែនទីស្ទ្រីមតម្លៃ៖ បង្កើតឧបករណ៍គ្មានខ្លាញ់មិនគួរឱ្យជឿ
Value Stream Mapping (VSM) គឺជាបច្ចេកទេសគ្រប់គ្រងគ្មានខ្លាញ់ដ៏មានឥទ្ធិពល ដែលជួយក្រុមហ៊ុនក្នុងការកែលម្អ និងមើលឃើញលំហូរការងាររបស់ពួកគេ។ ផែនទីដែលបង្ហាញពីរបៀបដែលព័ត៌មាន និងសម្ភារៈផ្លាស់ទីតាមរយៈក្រុមហ៊ុនអាចជួយពួកគេស្វែងរកភាពគ្មានប្រសិទ្ធភាព សម្រួលដំណើរការ និងបង្កើនប្រសិទ្ធភាព។ មិនថាអ្នកធ្វើការនៅក្នុងផ្នែកអភិវឌ្ឍន៍កម្មវិធី ការថែទាំសុខភាព ឬការផលិតនោះទេ VSM ផ្តល់ព័ត៌មានច្បាស់លាស់អំពីរបៀបដែលតម្លៃត្រូវបានផ្តល់ជូនអតិថិជន។
ភ្ជាប់ជាមួយនោះ ប្រកាសនេះនឹងនាំអ្នកទៅកាន់ ការគូសផែនទីតម្លៃស្ទ្រីមឧទាហរណ៍ និងគំរូ. ដូចគ្នានេះផងដែរ យើងនឹងជួយអ្នកក្នុងការបង្កើតផែនទីស្ទ្រីមតម្លៃដែលទទួលបានជោគជ័យ និងផ្តល់នូវឧទាហរណ៍ជាក់ស្តែងដើម្បីបញ្ជាក់ពីសារៈសំខាន់របស់វា។ ការយល់ដឹងអំពី VSM នឹងអនុញ្ញាតឱ្យអ្នកធ្វើការសម្រេចចិត្តដែលមានព័ត៌មានល្អដែលបង្កើនប្រសិទ្ធភាព អនុញ្ញាតឱ្យយើងចាប់ផ្តើមវានៅទីនេះ។

- ផ្នែកទី 1. អ្នកបង្កើតផែនទីស្ទ្រីមតម្លៃល្អបំផុត
- ផ្នែកទី 2. បញ្ជីនៃគំរូ VSM ទូទៅ និងឧទាហរណ៍
- ផ្នែកទី 3. សំណួរដែលសួរញឹកញាប់អំពីឧទាហរណ៍ការគូសផែនទីស្ទ្រីមតម្លៃ
ផ្នែកទី 1. អ្នកបង្កើតផែនទីស្ទ្រីមតម្លៃល្អបំផុត
MindOnMapការរចនាដែលងាយស្រួលប្រើ និងសមត្ថភាពដ៏រឹងមាំរបស់ធ្វើឱ្យវាក្លាយជាជម្រើសដ៏ល្អសម្រាប់ Value Stream Mapping ឬ VSM ។ កម្មវិធីនេះធ្វើឱ្យវាកាន់តែងាយស្រួលក្នុងការមើលឃើញ និងវិភាគលំហូរការងារ ដែលជួយសម្រួលដល់ការកំណត់អត្តសញ្ញាណនៃភាពគ្មានប្រសិទ្ធភាព និងផ្នែកកែលម្អសក្តានុពល។ លក្ខណៈសំខាន់ៗរួមមានៈ
• អូសនិងទម្លាក់។ លក្ខណៈពិសេសនេះធ្វើឱ្យវាសាមញ្ញក្នុងការបង្កើត និងកែសម្រួលផែនទីស្ទ្រីមតម្លៃដោយប្រើចំណុចប្រទាក់អូសនិងទម្លាក់ដែលវិចារណញាណ។
• គំរូដែលអាចប្ដូរតាមបំណងបាន។ បង្កើតផ្ទាល់ខ្លួនរបស់អ្នក ឬជ្រើសរើសពីគំរូដែលបានបង្កើតជាមុន ដើម្បីបំពេញតម្រូវការរបស់អ្នក។
• កិច្ចសហការតាមពេលវេលាជាក់ស្តែង៖ ធ្វើការក្នុងពេលដំណាលគ្នាជាមួយសមាជិកក្រុម ដើម្បីប្រាកដថាអ្នកគ្រប់គ្នាយល់ព្រម។
• ការវិភាគទិន្នន័យរួមបញ្ចូលគ្នា៖ ប្រើការវិភាគដែលភ្ជាប់មកជាមួយរបស់ឧបករណ៍ដើម្បីពិនិត្យមើលរង្វាស់នៃដំណើរការ និងធ្វើការជ្រើសរើសដែលផ្អែកលើទិន្នន័យ។
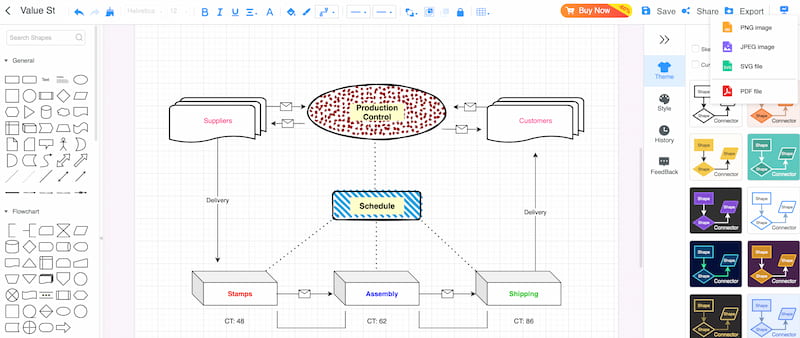
• ជម្រើសនាំចេញដោយរលូន៖ អ្នកអាចចែករំលែក និងបញ្ចូលផែនទីរបស់អ្នកទៅក្នុងរបាយការណ៍បានយ៉ាងងាយស្រួល ដោយនាំចេញពួកវាជាទម្រង់ផ្សេងៗគ្នា ដូចជា PNG និង PDF។
អ្នកអាចធ្វើផែនទី វាយតម្លៃ និងបង្កើនតម្លៃស្ទ្រីមរបស់អ្នកប្រកបដោយប្រសិទ្ធភាពដោយប្រើ MindOnMap ធ្វើអោយប្រសើរឡើងនូវប្រសិទ្ធភាពប្រតិបត្តិការ និងបង្កើតលទ្ធផលអាជីវកម្មដ៏ល្អឥតខ្ចោះ។ សូមមើលពីរបៀបដែលយើងអាចប្រើវា និងបង្ហាញពីលក្ខណៈពិសេសមិនគួរឱ្យជឿដែលវាមាន។
ការទាញយកដោយសុវត្ថិភាព
ការទាញយកដោយសុវត្ថិភាព
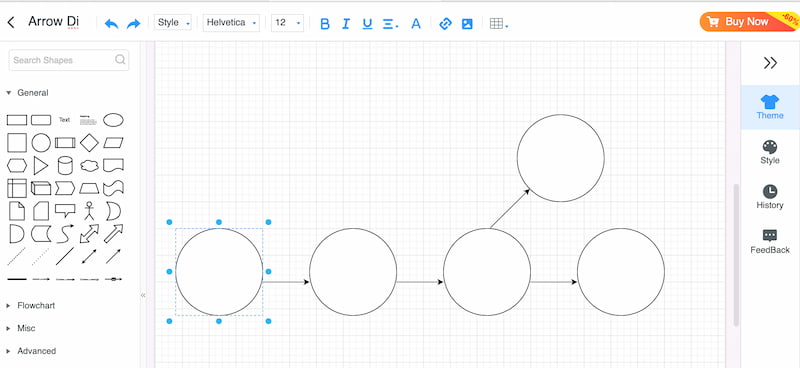
បើកឧបករណ៍របស់ MindOnMap នៅលើកុំព្យូទ័ររបស់អ្នក។ បន្ទាប់មកចូលទៅកាន់ប៊ូតុងសម្រាប់ New ហើយចុចលើ គំនូសតាងលំហូរ.
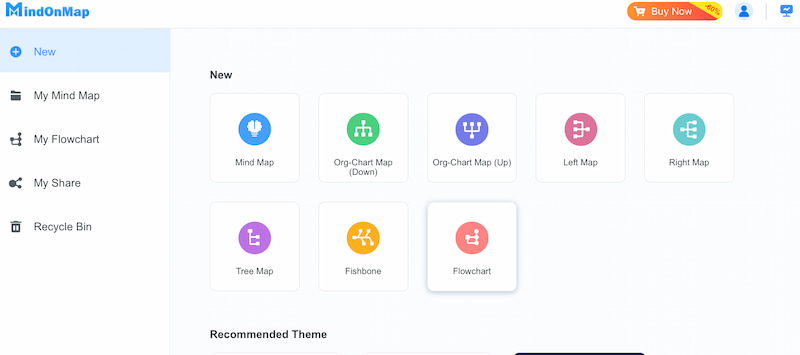
ឥឡូវនេះឧបករណ៍នឹងនាំអ្នកទៅកាន់កន្លែងធ្វើការរបស់វា។ នៅទីនេះឥឡូវនេះអ្នកអាចប្រើភាពខុសគ្នាដ៏ធំទូលាយនៃ រាង ដើម្បីបង្កើតផែនទីស្ទ្រីមតម្លៃដែលអ្នកត្រូវការ។ អ្នកអាចបន្ថែមរាងបានច្រើនតាមដែលអ្នកចង់បាន អាស្រ័យលើប្រភេទផែនទីដែលអ្នកកំពុងបង្កើត។
បន្ទាប់ពីដាក់រូបរាងទាំងអស់ដែលអ្នកត្រូវការនៅកន្លែងត្រឹមត្រូវហើយ នោះដល់ពេលត្រូវដាក់ស្លាករាងនីមួយៗតាមរយៈ អត្ថបទ ដើម្បីបន្ថែមព័ត៌មានលម្អិតបន្ថែមទៅតារាងលំហូរ។ ចងចាំថាត្រូវបន្ថែមរាល់ព័ត៌មានលម្អិត ដើម្បីកុំឱ្យមានបញ្ហានៅពេលនិយាយអំពីបទបង្ហាញ ឬរបាយការណ៍។
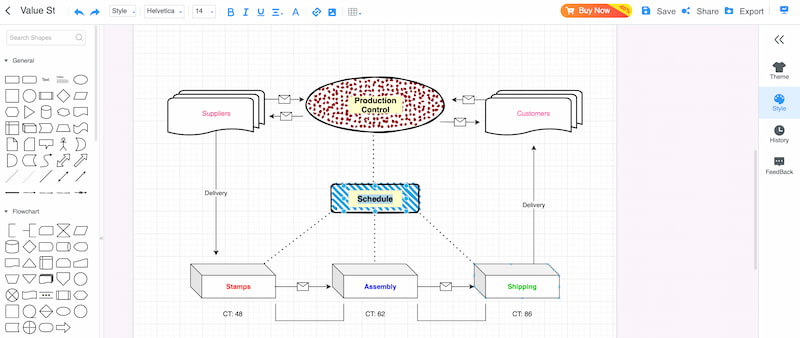
ទីបំផុត ឥឡូវនេះ យើងនឹងបញ្ចប់ផែនទីតម្លៃស្ទ្រីម ដោយផ្លាស់ប្តូររូបរាង និងរចនាប័ទ្ម។ ពីទីនោះ រក្សាទុក ផែនទីរបស់អ្នកឥឡូវនេះ។
នៅទីនោះអ្នកមានវា ផែនទី MinOnMap Visual Stream Map ដែលមិនគួរឱ្យជឿ។ យើងអាចមើលឃើញដោយប្រើជំហានសាមញ្ញ និងរូបរាងមិនគួរឱ្យជឿនៃឧបករណ៍ដែលយើងទទួលបានដើម្បីបង្កើតផែនទីស្ទ្រីមដែលទាក់ទាញដោយមើលឃើញ។ ដំណើរការគឺភ្លាមៗ ហើយលទ្ធផលគឺ extravagan ។ គ្មានឆ្ងល់ទេថាហេតុអ្វីបានជាមនុស្សជាច្រើន និងអ្នកជំនាញហៅវាថាជាឧបករណ៍ធ្វើផែនទីតម្លៃល្អបំផុត។ តើអ្នកកំពុងរង់ចាំអ្វី? ប្រើ MindOnMap ឥឡូវនេះ ហើយទទួលបានវា។ គំនូសតាងលំហូរតម្លៃ ជាមួយនឹងភាពងាយស្រួល។
ផ្នែកទី 2. បញ្ជីនៃគំរូ VSM ទូទៅ និងឧទាហរណ៍
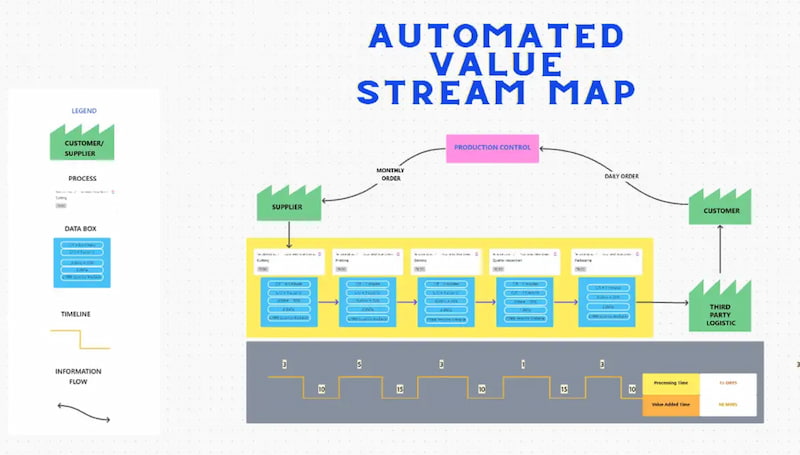
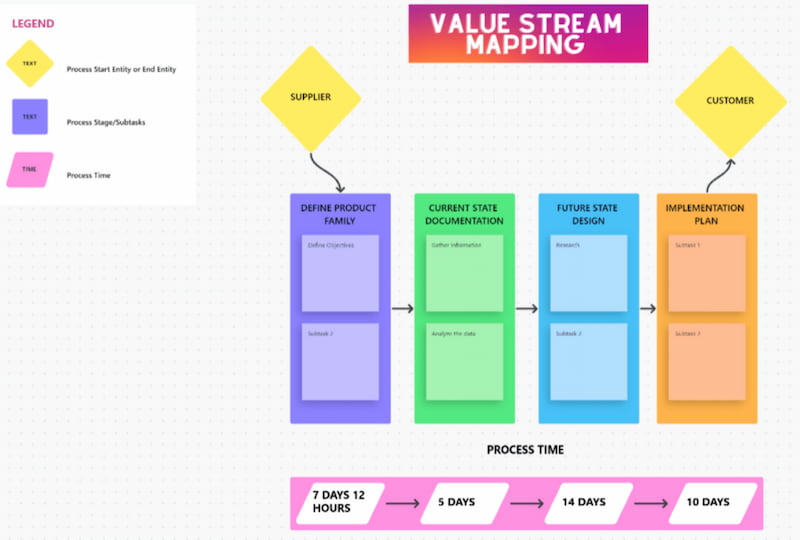
តម្លៃស្ទ្រីមដោយស្វ័យប្រវត្តិ ផែនទីស
ចង់លុបបំបាត់ភាពមិនច្បាស់លាស់ពីដំណើរការគូសផែនទីស្ទ្រីមតម្លៃ និងកំណត់តំបន់សម្រាប់ការកែលម្អបានត្រឹមត្រូវទេ? អ្នកអាចពឹងផ្អែកលើគំរូក្ដារខៀនស្ទ្រីមតម្លៃស្វ័យប្រវត្តិដើម្បីជួយអ្នក! ស្រដៀងទៅនឹងជម្រើសមុន គំរូការវិភាគផែនទីស្ទ្រីមតម្លៃនេះ សំបូរទៅដោយអត្ថប្រយោជន៍ដែលលើកកម្ពស់កិច្ចសហប្រតិបត្តិការ និងការងារជាក្រុម។ ភាពជាប់គាំងនៃដំណើរការខួរក្បាលគឺជារឿងធម្មតាដែលមានលក្ខណៈពិសេសដូចជាការកែសម្រួលពេលវេលាជាក់ស្តែង ការកត់ត្រា និងការភ្ជាប់ទៅកិច្ចការ និងឯកសារ។
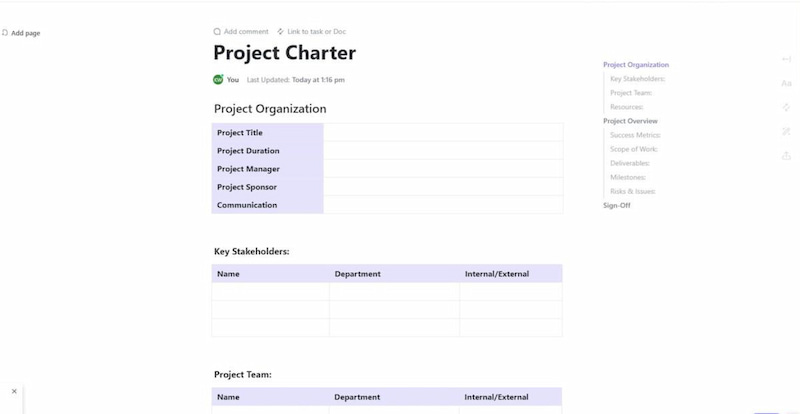
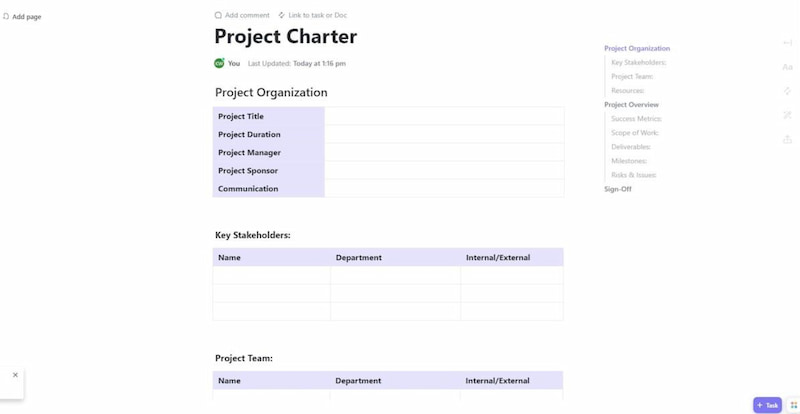
ការគូសផែនទីស្ទ្រីមតម្លៃ ClickUp
ជាមួយ ClickUp ការគូសផែនទីស្ទ្រីមតម្លៃ គំរូ អ្នកអាចប្រមូលផ្តុំសមាជិកនៃក្រុមផ្សេងៗ និងប្រើជំនួយដែលមើលឃើញ ដើម្បីទទួលបានទស្សនវិស័យដែលមានគោលបំណងលើលំហូរការងារ។ គំរូនេះត្រូវបានគេហៅថា Whiteboard; មើលវាជាផ្ទាំងក្រណាត់ឌីជីថល ដែលអ្នក និងសហការីរបស់អ្នកអាចសហការគ្នាដើម្បីស្រមៃមើល និងដោះស្រាយបញ្ហា ខណៈពេលផ្លាស់ប្តូរទស្សនៈ។ ដើម្បីធ្វើកិច្ចការកណ្តាល ClickUp Whiteboards ភ្ជាប់មកជាមួយនូវសមត្ថភាពភ្ជាប់មកជាមួយសម្រាប់ភ្ជាប់គំនិតទៅនឹងកិច្ចការ ឯកសារ និងឯកសារ។
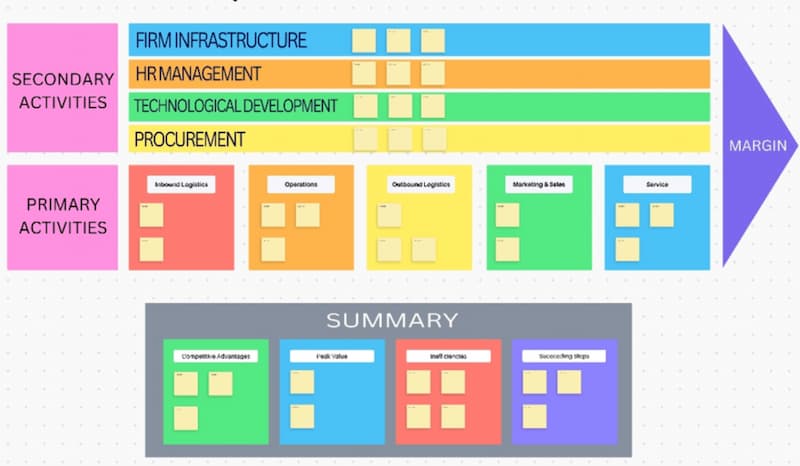
ខ្សែសង្វាក់តម្លៃ Whiteboard
ការបន្តបន្ទាប់នៃសកម្មភាពចម្បង និងការគាំទ្រដែលបន្ថែមតម្លៃដល់ផលិតផលមួយត្រូវបានតំណាងដោយបណ្តាញខ្សែសង្វាក់តម្លៃ។ គំរូក្តារបន្ទះសនៃខ្សែសង្វាក់តម្លៃ ធ្វើឱ្យវាអាចធ្វើទៅបានក្នុងការវិភាគខ្នាតតូចដូចជា ការទិញ ឃ្លាំង ធនធានមនុស្ស និងសូម្បីតែការគាំទ្របន្ទាប់ពីការលក់។ គំរូដែលមានពណ៌សមរម្យ ផ្តល់នូវមូលដ្ឋានគ្រឹះសម្រាប់បង្កើតខ្សែសង្វាក់តម្លៃដ៏ទូលំទូលាយ។ សម្រាប់សកម្មភាពបឋម ប្រើប្រអប់ការ៉េ ចំណែកសម្រាប់សកម្មភាពបន្ទាប់បន្សំ ប្រើក្រឡាចតុកោណកែង។
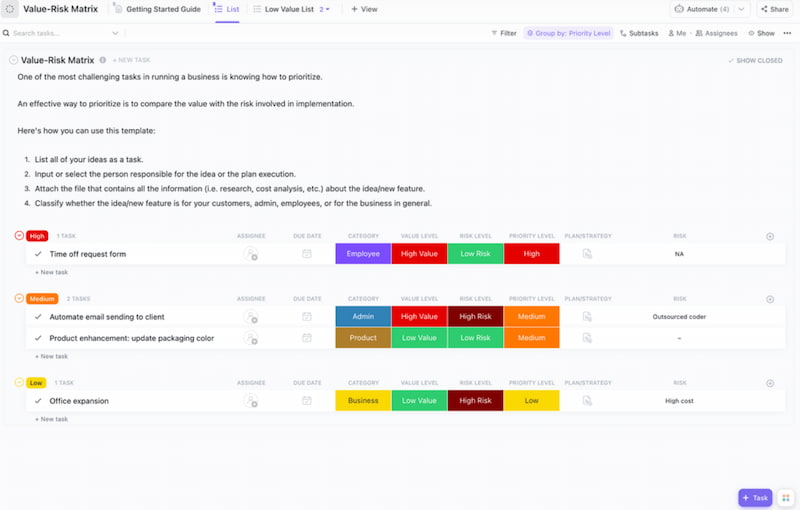
គំរូម៉ាទ្រីសហានិភ័យ
អ្នកគួរតែថ្លឹងថ្លែងពីហានិភ័យ និងតម្លៃបន្ថែមសក្តានុពល នៅពេលជ្រើសរើសថាតើត្រូវចាប់ផ្តើមគម្រោងថ្មី ឬធ្វើការផ្លាស់ប្តូរដ៏ធំមួយនៅក្នុងអាជីវកម្មរបស់អ្នក។ ប្រើគំរូម៉ាទ្រីសហានិភ័យ ដើម្បីជួយអ្នកកំណត់អាទិភាពគម្រោង និងសកម្មភាពដែលមានតម្លៃខ្ពស់ ប៉ុន្តែមានហានិភ័យទាប។
ដើម្បីបង្កើតទំនាក់ទំនងរវាងតម្លៃ និងភាពស្មុគស្មាញនៃការងារផលិតកម្ម គំរូមានលក្ខណៈពិសេសម៉ាទ្រីសហានិភ័យតម្លៃ។ ដើម្បីរក្សាការខិតខំប្រឹងប្រែងដែលមានហានិភ័យខ្ពស់ និងហានិភ័យទាបរបស់អ្នកត្រូវបានរៀបចំ សូមប្តូររវាងទិដ្ឋភាពបញ្ជី និងក្រុមប្រឹក្សា។
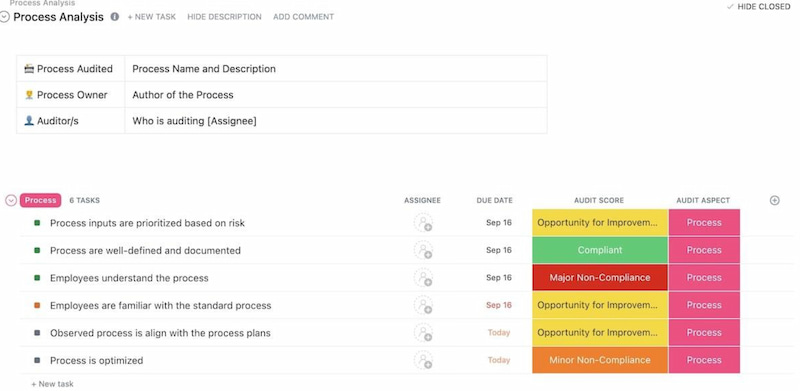
ដំណើរការសវនកម្ម និងការកែលម្អ
លំហូរការងារដែលមានប្រសិទ្ធភាពកាលពីអតីតកាលអាចក្លាយជាមនុស្សចាស់នៅពេលដែលក្រុមហ៊ុនរបស់អ្នករីកចម្រើន។ ដោយប្រើគំរូសវនកម្មដំណើរការ និងការកែលម្អ អ្នកអាចចាប់ផ្តើមធ្វើសវនកម្មដើម្បីវាយតម្លៃដំណើរការឡើងវិញទាក់ទងនឹងផលិតភាព និងប្រសិទ្ធភាពនៃការចំណាយ។ ដោយមានជំនួយពីឧបករណ៍នេះ អ្នកអាចវាយតម្លៃដោយស្មើភាពនូវនីតិវិធីបច្ចុប្បន្នរបស់អ្នក កំណត់អត្តសញ្ញាណកំហុសឆ្គង និងភាពបរិបូរណ៍ដែលកាត់បន្ថយផលិតភាព ឬផលចំណេញ និងអនុវត្តសកម្មភាពកែតម្រូវ។
ដំណើរការគំរូផែនទី
គំរូផែនទីដំណើរការគឺជាការជួសជុលរហ័សរបស់អ្នកសម្រាប់ការកាត់បន្ថយការចំណាយ បង្កើនផលិតភាព និងការកាត់បន្ថយកាកសំណល់។ គំរូនេះជួយអ្នកក្នុងការកំណត់អត្តសញ្ញាណ និងដោះស្រាយការស្ទះដោយផ្តល់ឱ្យអ្នកនូវការយល់ដឹងទូលំទូលាយអំពីទំនាក់ទំនងរវាងជំហានជាច្រើនដែលបង្កើតដំណើរការរបស់អ្នក។
គំរូកិច្ចការនេះមានកិច្ចការតូចៗចំនួន 22 ដែលបង្កើតជាបញ្ជីការងារត្រូវធ្វើ។ ពួកវានីមួយៗបង្ហាញពីគោលបំណងនៃការគូសវាសដំណើរការ និងផ្តល់ការណែនាំខ្លីៗអំពីវិធីដើម្បីសម្រេចវា។ ជាឧទាហរណ៍ កិច្ចការរងទីមួយកំណត់ដំណើរការដែលត្រូវកែលម្អ ហើយកិច្ចការរងទីពីរកំណត់បុគ្គលិកដែលពាក់ព័ន្ធនឹងការដឹកជញ្ជូន។
ធម្មនុញ្ញគម្រោងកែលម្អដំណើរការអាជីវកម្ម
ដើម្បីបន្តឈានទៅមុខនៃការប្រកួតប្រជែង និងអភិវឌ្ឍគំនិតផ្តួចផ្តើមជោគជ័យរបស់អតិថិជន អ្នកគ្រប់គ្រងគម្រោងចាំបាច់ត្រូវកែលម្អដំណើរការរបស់ពួកគេជាបន្តបន្ទាប់។ អ្នកអាចរចនា និងអនុវត្តលំហូរការងារដែលប្រសើរឡើងជាមួយនឹងឯកសារដែលមានសណ្តាប់ធ្នាប់ដោយអរគុណចំពោះគំរូធម្មនុញ្ញគម្រោងកែលម្អដំណើរការអាជីវកម្ម។
គំរូនេះប្រើរចនាប័ទ្មតារាងសាមញ្ញ។ ផ្តល់ព័ត៌មានអំពីគម្រោង អង្គការ និងអ្នកគ្រប់គ្រង ដើម្បីចាប់ផ្តើមកិច្ចខិតខំប្រឹងប្រែងថ្មី។ អ្នកទទួលបានតារាងដែលត្រូវបានរចនាឡើងជាពិសេសដើម្បីជួយអ្នកកំណត់តួនាទី និងការទទួលខុសត្រូវរបស់ក្រុមគម្រោងរបស់អ្នក និងអ្នកពាក់ព័ន្ធ។
ផ្នែកទី 3. សំណួរដែលសួរញឹកញាប់អំពីឧទាហរណ៍ការគូសផែនទីស្ទ្រីមតម្លៃ
តើអ្វីជាឧទាហរណ៍ក្នុងជីវិតពិតនៃចរន្តតម្លៃ?
ក្រុមហ៊ុនផលិតទំនិញប្រើប្រាស់គឺជាឧទាហរណ៍មួយនៃចរន្តតម្លៃនៅក្នុងពិភពពិត។ ស្ទ្រីមតម្លៃចាប់ផ្តើមជាមួយនឹងលទ្ធកម្មនៃវត្ថុធាតុដើម ដំណើរការតាមជំហាននៃការផលិត រួមទាំងការវេចខ្ចប់ ការធានាគុណភាព និងការជួបប្រជុំគ្នា ហើយបញ្ចប់ជាមួយនឹងការដឹកជញ្ជូនផលិតផលដែលបានបញ្ចប់ទៅឱ្យអតិថិជន។
តើអ្នកពន្យល់ពីការធ្វើផែនទីស្ទ្រីមតម្លៃដោយរបៀបណា?
បច្ចេកទេសគ្រប់គ្រងគ្មានខ្លាញ់ដែលហៅថា value stream mapping (VSM) ត្រូវបានប្រើដើម្បីបង្ហាញពីរបៀបដែលព័ត៌មាន និងសម្ភារៈផ្លាស់ទីដើម្បីផ្តល់សេវាកម្មល្អ ឬសេវាកម្ម។ វាជួយដល់អាជីវកម្មក្នុងការកំណត់ទីតាំងការស្ទះនៃដំណើរការ ភាពគ្មានប្រសិទ្ធភាព និងកិច្ចការដែលមិនមានតម្លៃបន្ថែម។ ជាមួយនឹង VSM ក្រុមអាចគូសផែនទីដំណើរការពេញលេញពីដើមដល់ចប់ និងកំណត់តំបន់ដែលអាចកាត់កាកសំណល់បាន។
តើ VSM ដំណើរការដោយរបៀបណា?
នៅក្នុង VSM ផលិតផលត្រូវតែត្រូវបានកំណត់ លំហូរការងារត្រូវតែត្រូវបានគូសផែនទី ភាពគ្មានប្រសិទ្ធភាពត្រូវតែត្រូវបានរកឃើញ ដំណើរការធ្វើឱ្យប្រសើរឡើងត្រូវតែត្រូវបានរចនាឡើង ផែនការសកម្មភាពត្រូវតែធ្វើឡើង ហើយការផ្លាស់ប្តូរត្រូវតែដាក់ឱ្យដំណើរការខណៈពេលដែលត្រូវបានត្រួតពិនិត្យយ៉ាងដិតដល់។
តើ VSM មានគោលបំណងអ្វី?
ការគូសផែនទីស្ទ្រីមតម្លៃ ដែលជួនកាលគេហៅថា ការធ្វើផែនទីដំណើរការគ្មានខ្លាញ់ ឬការវិភាគស្ទ្រីមតម្លៃ គឺជាបច្ចេកទេសសម្រាប់អនុវត្តការកែលម្អដំណើរការតាមរយៈការកាត់បន្ថយកាកសំណល់ និងរយៈពេលវដ្តដំណើរការខ្លី។ សមាសធាតុសំខាន់មួយរបស់ Lean Six Sigma (LSS) ដែលជាវិធីសាស្ត្រដ៏ល្បីសម្រាប់ការបង្កើនប្រសិទ្ធភាពដំណើរការគឺ VSM ។
តើកិច្ចការបីណាដែលបង្កើតផែនទីស្ទ្រីមតម្លៃ?
ផែនទីស្ទ្រីមតម្លៃមានបីប្រភេទ៖ ស្ថានភាពដ៏ល្អ ស្ថានភាពអនាគត និងស្ថានភាពបច្ចុប្បន្ន។ ជំហាននៅក្នុងដំណើរការចែកចាយតម្លៃបន្តត្រូវបានពិពណ៌នានៅក្នុងផែនទីស្ថានភាពបច្ចុប្បន្ន។ ផែនទីរដ្ឋដ៏ល្អ បង្ហាញពីកាលៈទេសៈដ៏ល្អឥតខ្ចោះ ដែលមិនមានដែនកំណត់ និងការជាប់គាំង។
សេចក្តីសន្និដ្ឋាន
ស្ទ្រីមតម្លៃនៃគំរូអាជីវកម្មគឺជាសំណុំនៃនីតិវិធី និងសកម្មភាពដែលវាប្រើដើម្បីបង្កើនធាតុចូល និងផ្តល់ទំនិញដល់អតិថិជន។ គំរូ និងឧទាហរណ៍នៃការធ្វើផែនទីស្ទ្រីមតម្លៃអនុញ្ញាតឱ្យអ្នកបង្កើតផែនទីបានយ៉ាងងាយស្រួល និងរហ័ស ដែលបង្ហាញពីតំបន់ដែលអាចធ្វើទៅបានសម្រាប់ការកាត់បន្ថយកាកសំណល់សម្ភារៈ និងកម្លាំងពលកម្ម។ លើសពីនេះ MinddOnMap គឺនៅទីនេះដើម្បីជួយយើង បង្កើតគំនូសតាងលំហូរ ដែលមានភាពងាយស្រួល និងគុណភាពល្អជាង ដូចជាតារាង VSM ជាដើម។ សូមចាំថា ឧបករណ៍គ្មានខ្លាញ់ដែលហៅថា ផែនទីស្ទ្រីមតម្លៃ ជួយក្នុងការបង្កើតធនធានភាគច្រើនរបស់ក្រុមហ៊ុន និងធានាថាពេលវេលា និងសម្ភារៈត្រូវបានប្រើប្រាស់ប្រកបដោយប្រសិទ្ធភាព។ ដូច្នេះសូមប្រើ MindOnMap ដើម្បីធ្វើឱ្យវាមានប្រសិទ្ធភាព និងមានប្រសិទ្ធភាព។

បង្កើតផែនទីគំនិតរបស់អ្នកតាមដែលអ្នកចូលចិត្ត