Gezi-diagrama nola egin: sortzeko 3 tresna eta modu onenak
Fluxu-diagramak eta diagramak sortzeak denbora luzea izan dezake eskuzko prozesuen mapak, taldeen kontsultak eta erabakiak hartzea eskatzen baitute, eta horrek guztiak denbora desbideratzen du benetako proiektuko lanetik. Erlazionagarria den egoera da hau, batez ere salmenta, marketina eta beste antolakuntza-esparruetara joera duten profesionalentzat.
Horrekin lotuta, fluxu-diagramen softwareak karga hori murrizten du eta akatsak eta atzerapenak murrizten ditu diagramak sortzeko modu eraginkorrak eskainiz, hala nola gezi-diagramak. Zuretzako aukerarik onena hautatzea gezi-diagrama sortzaileak erronka izan daitezke, baina zorte ona duzu tresna on bat aurkitzen laguntzeko hemen gaudelako. Argitalpen honek beheko fluxu-diagramako tresna onenak aztertzen ditu. Mesedez, ikusi itzazu orain.
- 1. zatia. Gezi-diagramaren definizioa
- 2. zatia. Gezi-diagramaren erabilerak
- 3. zatia. Gezi-diagramaren adibidea eta txantiloia
- 4. zatia. Gezi-diagrama-egileen berrikuspena
- 5. zatia. Sortu gezi-diagrama linean
- 6. zatia. Zer den Arrow Diagramari buruzko galderak
1. zatia. Gezi-diagramaren definizioa
Gezi-diagrama proiektu jakin bateko xehetasun askoren arteko loturak erakusten dituen laguntza bisuala da. Plan bateko zeregin bakoitza zer ordenatan burutzen den zehazten du. Diagrama honek jarduera askoren elkarrekiko mendekotasuna eta lotura irudikatzen du. Erabiltzaile batek plana ikus dezake sorreratik inplementaziora eta amaitzeraino tresna hau erabiliz. Zeregin garrantzitsu eta zailak proiektuaren atzerapenak eragiten ditu maiz. Gezi-diagramak funtsezko ekintzen sekuentzia argitzen du errendimendua bizkortzeko eta erabakiak hartzeko prozesuan alferrikako atzerapenak murrizteko.
2. zatia. Gezi-diagramaren erabilerak
Gezi-diagrama ezinbestekoa izan daiteke hainbat modutan. Gehienetan, erabiltzaileek diagrama hau erabiltzen dute hurrengoetarako:
Administrazioaren estrategia eraginkorra
Proiektu bat gezi-diagrama erabiliz trazatzen denean, proiektuaren kudeaketa errazagoa da. Horrela, zereginak betetzearen jarraipenak zure kudeaketaren eraginkortasuna ezagutzeko aukera ematen dizu.
Helburuak ezartzea eta argitzea
Zuzendaritzak proiektua kontzeptualizatzen hasi zen gezi-diagrama bat sortuz, ekintza guztiak gardenagoak eta ulergarriagoak bihurtuz. Kudeatzaileen kezka eta argitasuna areagotu zuen jarduera erabakigarriekin lotutako zereginen inguruan.
Talde Elkarlana
Zuzendaritzak gezi-diagrama erabiliz plana prozesatzen duenean, taldea etapak erraz ulertzen hasten da. Prozesu osoa grafiko soil batera murrizten da, metodo konplexu estandar gisa irudikatzen jarraitu beharrean. Horrela, proiektu bat ulertzeak talde-lanaren komunikazioa hobetzen du.
Zereginen Sekuentzia gehitzea
Gezi-diagrama erabiliz, zereginak sekuentzia batean multzokatzen dira, haien menpekotasun eta interkonektibitatearen arabera. Hori dela eta, aurreikusitako ikastaro batetik geroko zeregin batera alboratzeko probabilitatea murrizten da.
Proiektu baten denbora-lerroaren jarraipena
Diagrama baten lerro luzeak zeregin bat noiz amaitu behar den adierazten du. Horrek langileei zeregin bat behar baino beranduago amaitzearen arriskua eta lehenago bukatzearen abantailak ulertzen laguntzen die.
3. zatia. Gezi-diagramaren adibidea eta txantiloia
Atal honek proiektu-kudeatzaileek bi gezi-diagrama txantiloi hauek nola erabil ditzaketen azaltzen du plangintza hobetzeko. Txantiloi hauek denbora asko aurrezten dute estetikoki erakargarriak diren fluxu-diagramak eta gezi-diagramak sortzean. Gezi-diagrama-estilo ideal bakarra ez dagoela kontuan hartuta, ikus dezagun proiektu-kudeatzaileek txantiloi desberdinekin zer lor dezaketen.
Timeline Arrow Diagram txantiloia
Gezien goiko erdian datak gehitzeko eta jarduerak gezi-fluxu-diagrama lineal honen beheko erdian daude. Proiektuen epeak eta ordutegiak erakusteko aproposa da. Fluxu-diagrama hau gezi-txantiloiarekin mugarriak ezartzeko eta proiektuaren oinarrizko ordutegiak ezartzeko erabil daiteke.
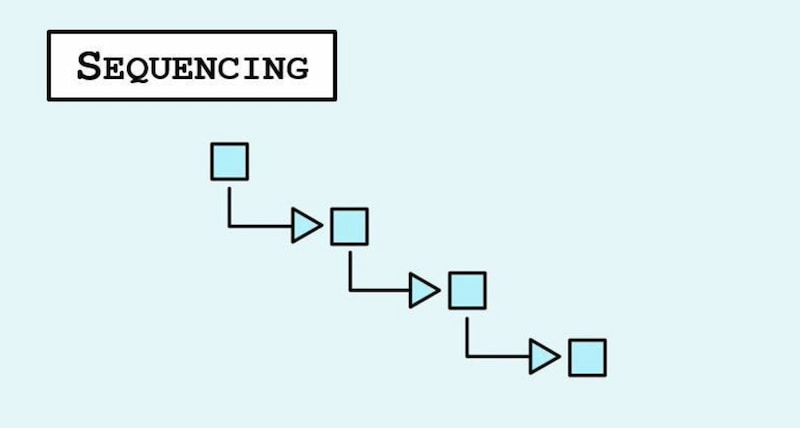
Prozesuaren Sekuentzia
Lan txikiago eta prozedura korapilatsu asko biltzen dituzten proiektuen adibide bikaina da. Fluxu-diagramaren geziek atazak nola banatzen eta bat egiten duten erakusten dute. Adibide honetan bi forma daude: laukizuzenak eta zirkuluak. Txantiloi honek ondo funtzionatzen du hainbat fase edo urrats dituzten zereginetarako, adibidez, produktu berri bat planifikatzeko edo garatzeko.
4. zatia. Gezi-diagrama-egileen berrikuspena
MindOnMap
Prezioa: Doan
Plataformak: Online, iOS, Android, macOS eta Windows.
Onena:
Horrekin MindOnMap, fluxu-diagramak eta mapak sortzea nahiko erraza da eta ideia sortzaileenak ateratzen lagun zaitzake. Lineako buru mapak egiteko tresna denez, baliteke kontzeptu garrantzitsuak eta inspirazio iturriak berehala grabatzen has zaitezke ez duelako instalazio edo konfiguraziorik behar. Gainera, gezi-diagrama-sortzaileak hainbat ezaugarri sendo eskaintzen ditu negozioan edo zure bizitza pertsonalean zure eskakizunei erantzuteko, hala nola, hizkeraren eskemak, plangintza, ikasgaiak, ikastaroak eta oharrak hartzea. Buru-mapa bat sortzen duzunean, zure pentsamenduak automatikoki gordetzen ditu, lagunekin edo lankideekin azkar eta erraz parteka ditzazun.
PROS
- Zortzi mota ezberdinetako buru-mapa baino gehiagorekin.
- Tresnak hodeiko biltegiratze kopuru infinitua du.
- Partekatu buru-mapak modu seguruan pasahitza erabiliz.
- Lagundu web-oinarritutako mapa mentalak editatzen.
KONTRA
- Buru mapak egiteko txantiloiak ez dira nahikoak.
Miro
Prezioa: $8 hilean
Plataformak: Webgunea
Onena: Komunikazio-eginbide integratuak
Miro sareko arbelaren lankidetza-tresna bat da, bere moldagarritasunagatik ezaguna. 1.000 txantiloi baino gehiago eskaintzen ditu, hala nola, mapa mentalak, fluxu-diagramak, Kanban taulak eta abar.
Miro-ren plataformaren ezaugarri berezia ideiak adierazteko modu desberdinak konbinatzeko gaitasuna da. Honen barruan sartzen dira lehendik dauden diagramak igotzea eta hobetzea eta hainbat material gehitzea, hala nola, argazkiak eta bideoak, fluxu-diagrametan. Botoen, itsaskorren eta iruzkinen gaitasunen bidez, plataformak taldeen lankidetza interaktiboa ere sustatzen du, taldeek denbora errealean ideiak partekatzeko eta hobetzeko aukera emanez.
PROS
- Komunikazio tresna integratuak talde lan eraginkorra izateko
- Konfigurazio sinplea eta intuitiboa
- Doako plana mugagabean eskuragarri
KONTRA
- Doako bertsioak kalitate handiko PDF esportazioa eragozten du.
- Baliteke proiektu handiagoetan zooma egitea irregularra izatea.
- Gonbidatu/bisitari kontuak premium planetan soilik daude eskuragarri.
Sortu
Prezioa: $8 hilean.
Plataformak: Sarean
Onena: Fluxu-diagrama-sortzailea
Sortu Datu-konexioa duen lan-espazio bisual bat da, non enpresa berrientzako estrategiak egin eta ideiak sor ditzakezun. Programak fluxu-diagramak sortzea erraz eta azkar egiteko diseinatuta dago. Lehenik eta behin, erraza da zure beharretara egokitzen den txantiloia hautatzea, industria eta gai ugari biltzen dituen liburutegi handi bat duelako, HR kontratazio prozeduretatik hasi eta UI/UX erabiltzaile-fluxuetaraino. Izan ere, Creatlu gezi-diagrama lineako tresna bikaina da zuretzat.
PROS
- Aplikazio askotako zereginak konbinatu eta zentralizatzen ditu.
- Kanban arbeletara sartzeko taldean elkarrekin lan egitea.
- Taldeek errazago funtziona dezakete txantiloi bilduma zabalari esker.
KONTRA
- Tutorial gehigarriak gehitu litezke tresnan erabiltzaileei laguntzeko.
- Batzuetan, datu asko dituen diagrama bat kargatzen denean, tresnak atzeratzen dira.
- Gainera, noizean behin, Desegin eginbidea erabiltzen denean, trabatu egiten da.
5. zatia. Sortu gezi-diagrama linean
Zati honetan, gezi-diagrama sortu eta marraztuko dugu. Horrez gain, behar dituzun funtzioak besterik gabe eskain ditzakeen tresna bikain bat aurkeztuko dizugu. MindOnMap deritzo hitz egiten ari garen tresna. Goian ikus dezakegunez, tresnaren deskribapena nahiko interesgarria da. Egia esan, kalitate handiko irteerako gezi-diagrama bat sortzen lagunduko digu. Horren ildotik, ikus dezagun nola erabil dezakegun tresna.
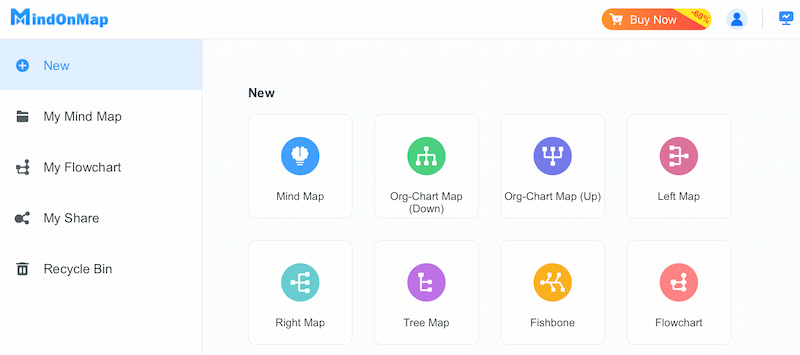
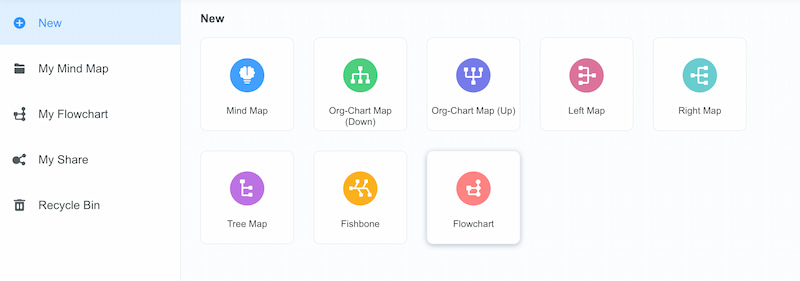
Instalatu dezagun MindOnMap gure ordenagailuan eta abiarazi berehala. Hortik aurrera, mesedez sartu Berria botoia eta aukeratu Fluxu-diagrama.
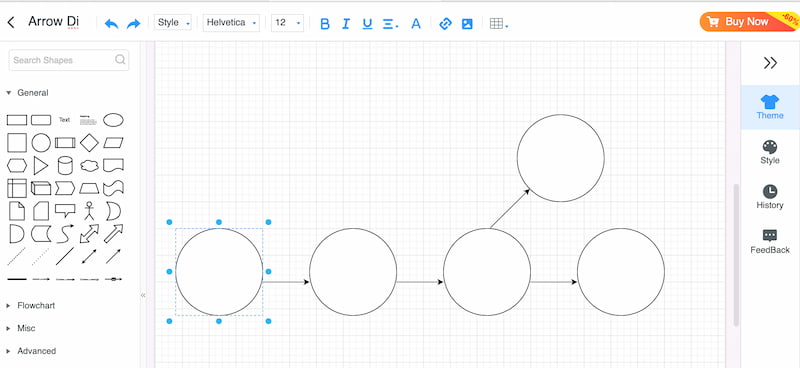
Hori egin ondoren, tresnak bere lan-eremura eramango zaitu. Horrek esan nahi du orain gure gezi-diagramarako nahi ditugun formak gehitzen jarraitu dezakegula. Kontuan izan ez duzula ahaztu behar Geziak gehitzea gehitu dituzun formen artean.
Egin behar dugun hurrengo gauza forma bakoitzari etiketatzea da. Hori egin dezakegu formen klik eginez eta idatziz Testua.
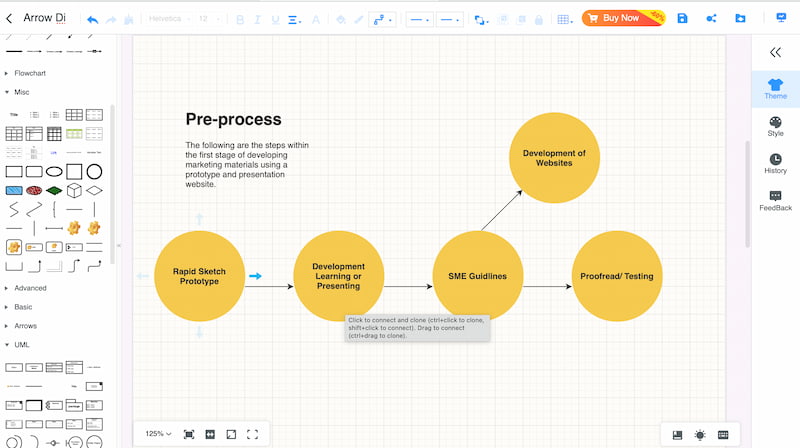
Horren ondoren, diagrama amai dezakezu aukeratuz Estiloak edo Gaiak nahi duzu. Hortik aurrera, ezin dugu zure gezi-diagrama gorde klik eginez Gorde ikonoa.
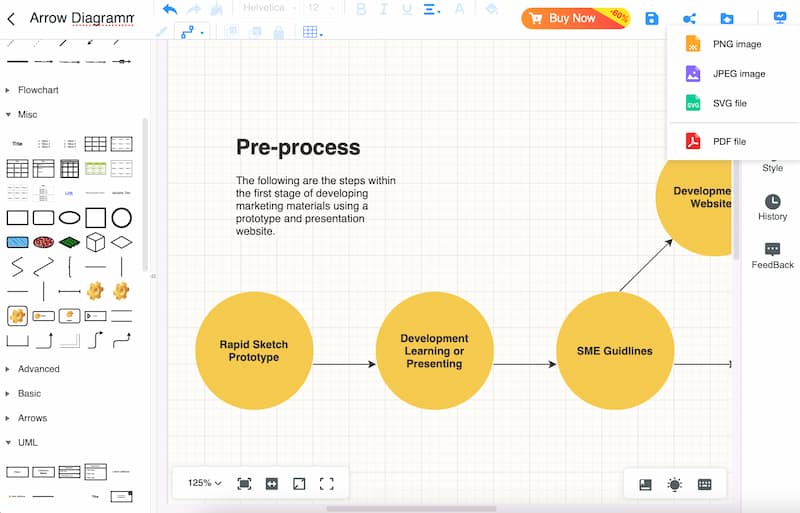
Ikusi hor? Arrow Diagram bezalako diagrama bat sortzeko prozesua oso erraza da sortzeko, eta erabiltzaile berriek ere denbora erraz bat izan dezakete hori egiteko. Iradokizunetarako, gezi-diagrama hau erabil dezakezu eta zure hobespenen arabera edita dezakezu.
6. zatia. Zer den Arrow Diagramari buruzko galderak
Zein erlazio adierazten da gezi-diagramaz?
Gezi-diagrama batek multzo bateko elementuen arteko erlazioak erakusten ditu, domeinua, eta beste multzo bateko elementuak, kodomeinua. Erlazioa funtzio bat da, domeinuko elementu bakoitza kodomeinuko elementu batekin zehazki lotuta badago. Elementu bat ez da funtzioa beste elementu batzuekin loturak baditu; aitzitik, erlazio orokorra da.
Zeintzuk dira gezi-diagraman identifikatu beharreko lau faktoreak?
Gezi-diagrama baten analisiak lau elementu garrantzitsu erakusten ditu. Lehenengoa Domeinua da, hau da, sarrera-bildumako elementu guztiak. Bigarrenik, Codomain dugu, hau da, irteerako osagai potentzialen multzo osoa. Jarraian, domeinuaren eta kodomeinuaren elementuen arteko erlazioak irudikatzen dituzten geziak mapaketa gisa ezagutzen dira. Azkenik, konexio mota. Elementuak mapatzeko moduaren arabera, konexioa funtzio bat izan daiteke edo ez.
Zer esan nahi du sare-diagrama baten geziak?
Gezi batek gai zehatz bati lotutako zereginak adierazten ditu. Gezi eskematiko hauek hurrengo ekintzaren norabidea adierazten dute. Gezi baten luzerak zeregin edo jarduera bat amaitzeko zenbat denbora beharko duen adierazten du.
Zein da gezi-diagrama baten izena?
Gezi-diagrama proiektu zehatz bat sekuentzialki irudikatzeko metodo bat da. Baliabideen esleipen korapilatsua eta prozesu erabakigarriak errazten ditu urratsez urrats prozedura zuzen batean. Diagrama honen beste izen batzuk honako hauek dira: Jarduera-sare-diagrama, geziaren programazio-metodoa, jarduera-sare-diagrama, jarduera-diagrama, nodo-diagrama eta CPM edo bide kritikoaren metodoaren diagrama.
Zer esan nahi du matematikako gezi-diagramak?
Bi multzoen arteko erlazioa matematikan bikote ordenatuen bilduma bezala ezagutzen da, non bikote bakoitzak multzo bakoitzeko objektu bat duen. Beraz, bi multzo edo nodo matematikoren arteko erlazioa Gezi-diagrama baten bidez adierazten da.
Ondorioa
Gezi-diagramek onura handia izan dezakete proiektu-kudeatzaileei. Proiektuaren ibilbide kritikoak aztertzen laguntzen dute eta lotura konplexuak grafikoki irudikatzen dituzte. Enpresek ere beren baliabideak optimiza ditzakete gezi-diagramak erabiliz. Saiatu EdrawMax erabiltzen diagramen ekoizpen eraginkorra lortzeko. EdrawMax-en UI intuitiboek eta aurrez egindako txantiloiek proiektuaren zereginak ikustea eta ordutegian amaitzea errazten dute.