What is a Tree Diagram: Definition, Pros & Cons, When to Use, and All
A tree diagram is used as one of the simplest ways to display cause and effect, probabilities, and a series of events. It allows the maker to expand the topic as much as required by branching out with a central topic. But there is more to this diagram than meets the eye. In today’s article, we will dig deeper into it by discussing its definition, advantages, and disadvantages, when it is helpful, and so much more.
Therefore, if you wish to have in-depth knowledge about this diagram and learn how to create it, you may check out the paragraphs below.

- Part 1. What is a Tree Diagram
- Part 2. Advantages and Disadvantages of a Tree Diagram
- Part 3. Tree Diagram Examples
- Part 4. When is a Tree Diagram Helpful
- Part 5. How to Make a Tree Diagram Online
- Part 6. FAQs About a Tree Diagram
Part 1. What is a Tree Diagram
A tree diagram is a flexible diagram that features various evident capabilities. Hence, it is also referred to as tree analysis, analytical tree, hierarchy diagram, and systematic diagram. As a matter of fact, it is being utilized as the modern management planning tool. This is because it can display a hierarchy of tasks and subtasks that need to be accomplished.
It basically starts with one item, also known as a central topic, that branches into more. Moreover, each of which has its sub-branches. Then, once you have already finished creating a diagram, you will see a tree-like form, thus the name. There is a trunk and multiple branches in the diagram.
Part 2. Advantages and Disadvantages of a Tree Diagram
Now, we will explain a tree diagram’s advantages and disadvantages. Through it, you will learn how to maximize this visual technique and when it is not ideal to use. So, without much ado, here are the merits and demerits of a tree diagram.
PROS
- When it comes to data preparation during pre-processing, tree diagrams, require less effort compared to other algorithms.
- Almost everybody can understand a tree decision diagram. Their intuitive characteristics make it easy for you to explain a situation to your technical teams and stakeholders.
- If you are a fan of data normalization, a decision tree is for you.
- A tree diagram works even when some values are missing. In other words, missing values do not have a big effect on the process of building.
- Data scaling is not a problem when it comes to creating a tree diagram.
CONS
- A tree diagram model is not best for applying regression and predicting values that are continuous.
- Despite being intuitive, it tends to be complicated and complex.
- A small change in the data may contribute to a big change in the structure model of the tree diagram.
- Instability is one of its major enemies.
- Training for a tree diagram is expensive because of the complexity and time needed.
Part 3. Tree Diagram Examples
A tree diagram has a broad scope. In fact, it can cover math, statistics, and linguistics. Therefore, we will take a glance at these examples. Check them below.
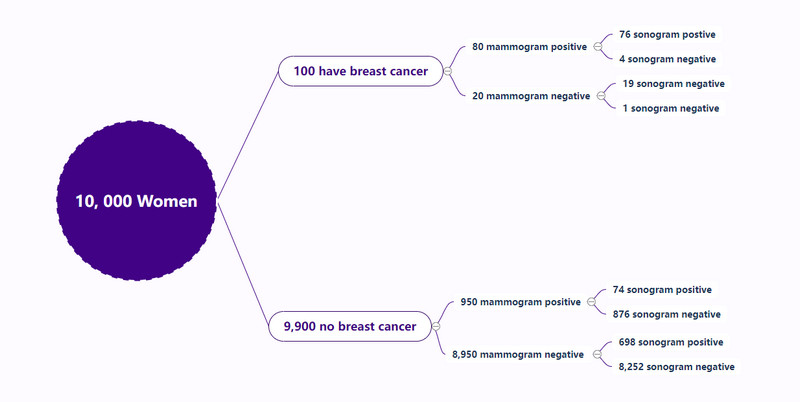
Tree Diagram for Math
As stated, a tree diagram is an excellent tool for determining probabilities. Then ends represent the leaves of a tree, and there are also branches. Each probability is written on the branches, and outcomes are placed on the ends of the branches. This diagram is also considered as a tree diagram in statistics, especially when identifying frequencies.
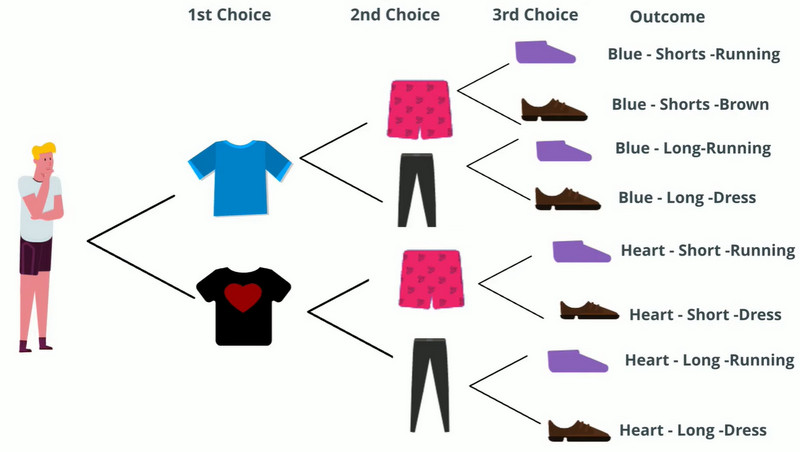
Tree Diagram for Kids
Now, we have a tree diagram for kids. This example helps to determine the potential outfit the person would wear. In line with this, it could help kids and students pick the possible outfit for the person.
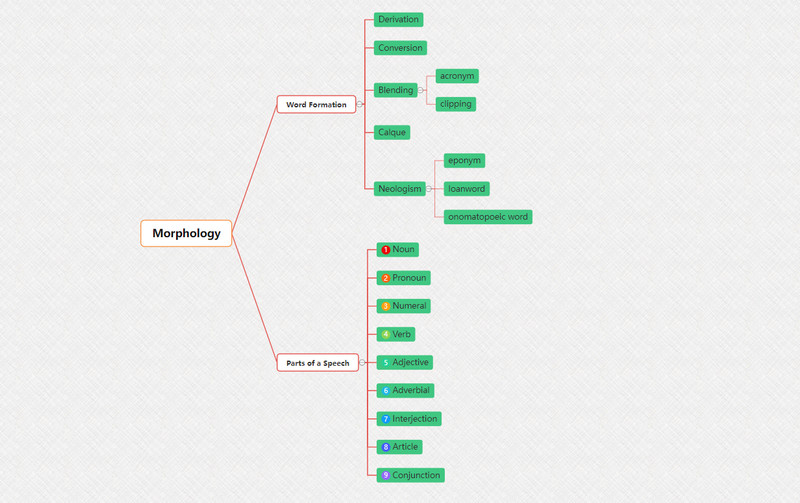
Tree Diagram in Linguistics
A tree diagram is not only for depicting probabilities. It can also be used for dissecting and understanding a language in the subject of Linguistics. The morphology, an example below, shows what it looks like.
Part 4. When is a Tree Diagram Helpful
It is the time when you will decide whether to use this diagram or not. Hence, we also made a paragraph when you will use a tree diagram or when it comes into play.
◆ You will use a tree diagram to depict the tasks and subtasks to be completed.
◆ Analyzing a situation and developing actions to formulate solutions.
◆ You can also use a tree diagram when developing logical steps when achieving an objective.
◆ It helps you to communicate well with stakeholders and technical teams to explain details.
◆ This visual tool is developed for evaluating implementation issues for solutions.
Part 5. How to Make a Tree Diagram Online
This time, let us get into the procedure for making a tree diagram. Actually, you can do this diagram by hand or using a pen and paper. Yet, it would be best to have it done using a dedicated tree diagram maker. MindOnMap has everything you need to make a tree diagram. You can play with different layouts, like right and left maps. You can also portray an org chart or an upside-down org chart.
Moreover, the icons and figures will help you make the diagram comprehensive. As for the style, it comes with different themes you can apply to your tree diagram. So, let us get started.
Launch MindOnMap on any web browser and visit the program’s home page. Then, tick Create Online or Free Download from the main page, and you will arrive at the program’s dashboard.
Secure Download
Secure Download

From the dashboard window, choose the layout you prefer, and it will bring you to the main editing panel of the tree diagram maker.

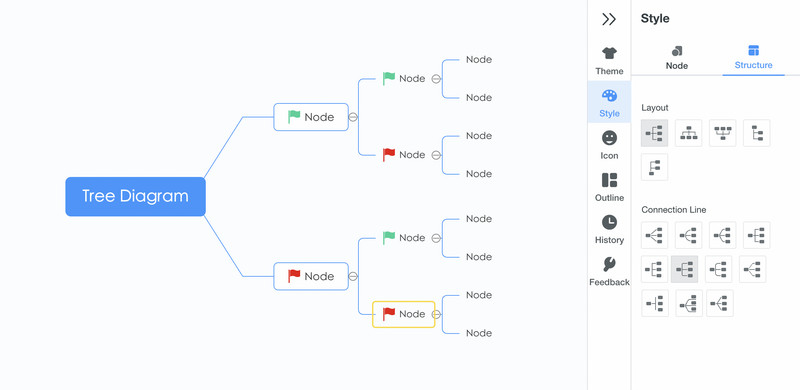
This time, select the central topic and branch out by clicking the Node button on the top menu. Alternatively, you may press the Tab key on your computer keyboard while selecting the central node or item. Keep adding until you get your desired branches, which should form like a tree.

Insert the information needed using the double-click action on each branch. You may customize the branch color, font, or connection line by then. Simply go to the Style menu on the right-sidebar menu. Then, change the properties. Under the Structure tab, you can see different layouts you may apply.
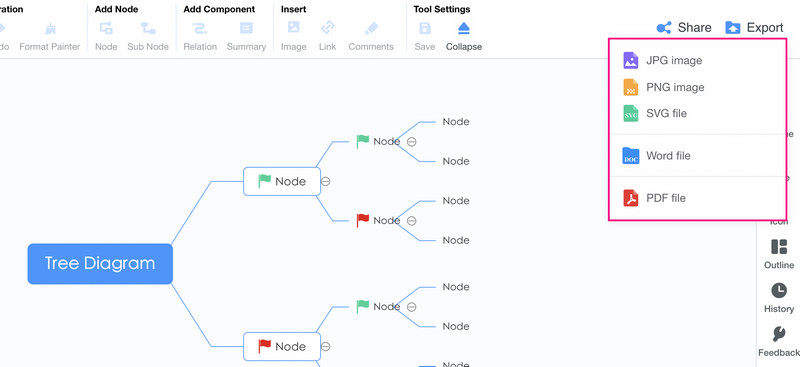
Finally, tick the Export button on the top right menu and select the format appropriate for your needs.
Further Reading
Part 6. FAQs About a Tree Diagram
What is a tree diagram in Math?
Math has a big involvement because probability values are calculated along with the outcomes. The formula is adding the probabilities together and multiplying the probability values of the branches connected.
What are the types of tree diagrams?
There are Y to X tree diagrams, cause and effect tree diagrams, functional tree diagrams, and abstraction tree diagrams.
Can I create a tree diagram in Word?
Yes, it is possible. You can do it automatically by accessing the SmartArt feature. Go to SmartArt under the Insert tab. Then, select Hierarchy and select a template. Finally, edit the template.
Conclusion
That is it! A nitty-gritty of a tree diagram. Additionally, you have learned some examples of this visual tool and how to create one using the excellent online tool, MindOnMap. Therefore, you can maximize it and use it in a real-life situation.


