Tape Diagram: An Analysis and Step-by-Step Tutorial for Visual Learning
Tape diagram, bar models, or strip diagrams are helpful tools that can change how you tackle math problems. They give you a clear picture of tricky ideas, making it easier to understand how numbers and math are connected and better solve problems. This guide will show you how to use tape diagrams for all sorts of math, from simple addition to tricky word problems. We'll talk about why they're great, who should use them, and, most importantly, how to make your effective tape diagrams. Let's jump into the tape diagram and unlock your math skills.

- Part 1. What is a Tape Diagram?
- Part 2. What's the Benefit of a Tape Diagram?
- Part 3. What is a Tape Diagram Used for?
- Part 4. Who Can Use a Tape Diagram?
- Part 5. How to Make Tape Diagrams?
- Part 6. FAQs About Tape Diagram
Part 1. What is a Tape Diagram?
A tape diagram math, a bar model, is handy for showing math ideas and figuring out problems, especially when dealing with basic numbers and equations. It's useful for showing how different amounts are related and is a big part of teaching math in elementary and middle school. Here's a quick rundown on what a tape diagram is and how it helps:
In short, tape diagram definition is a handy and good way to picture and figure out math problems, helping you better understand and reason in math.
Part 2. What's the Benefit of a Tape Diagram?
Tape diagrams are beneficial for getting and fixing math problems because:
• It readily shows math ideas, helping you understand how numbers are related.
• It splits big problems into smaller, easier-to-handle pieces, making figuring out solutions much smoother.
• They show how numbers relate to each other, like how parts make up a whole or how numbers compare.
• You can use a tape diagram to show your thoughts about math and why you feel that way.
• It helps you get used to thinking about math in terms of unknowns, a big part of algebra.
Students can grasp math ideas using tape diagrams and feel more confident about solving problems.
Part 3. What is a Tape Diagram Used for?
A tape diagram is handy for many reasons, especially in math classes. Here's what it's good for:
• Seeing Math Relationships: It helps people, like students and learners, better understand how different parts of a math problem are connected. It makes it easier to see how everything fits together.
• Solving Word Problems: Tape diagrams are super helpful when figuring out what a word problem is asking. They make it simpler to turn a word problem into a math equation or expression by showing what's happening with numbers and their relationships.
• Getting the Hang of Fractions and Ratios: Tape diagram fractions make it easier to understand how fractions and ratios work. They can show you how a whole split up or how different numbers compare.
• Getting Better at Algebra: You can use tape diagrams to show algebraic expressions and equations, which helps students get a better grip on variables, constants, and how to do math operations.
• Comparing Numbers: A tape diagram can help you determine which number is bigger or show how much one number differs from another.
• Teaching Math Ideas: Teachers use tape diagrams to help students understand tricky math ideas. By breaking down problems into easy-to-see parts, tape diagrams make math concepts that seem hard to grasp easier to understand.
In short, tape diagrams are a great tool in math. They clarify concepts, help solve problems, and make understanding math much easier.
Part 4. Who Can Use a Tape Diagram?
Tape diagrams are a handy tool for a bunch of people, like:
• Students: Kids, especially those in elementary and middle school, often use tape diagrams to learn math and solve problems. They're great for kids who like to see how numbers and amounts are connected.
• Teachers and Educators use tape diagrams to help break down math ideas and make them easier for their students to understand. They can make tricky math concepts such as numbers, fractions, ratios, and algebra more real and easier to grasp.
• Parents and Tutors: Parents or tutors who help with math homework or give extra help can be very helpful in explaining things and showing how to solve problems.
• Math Lovers and Learners: If you're into math or want to improve, it can help you dive into math relationships and tackle problems.
• Professionals: In some jobs, like finance or engineering, tape diagrams or similar tools might show how different amounts or quantities are related.
In short, tape diagrams are cool and useful for anyone learning, teaching, or using math. They make math relationships clear and easy to see, which is great for many people.
Part 5. How to Make Tape Diagrams?
You can get the hang of making good tape diagram math with some practice. In this part, we will look at different tools and ways to ensure your tape diagrams are right and nice. We'll talk about MindOnMap, EdrawMax Online, and Boardmix. By learning what each tool can do, you can pick the one that fits what you need and like best. Let's start by checking how to make tape diagrams with these tools.
Method 1.MIndOnMap
MindOnMap is a tape diagram maker that makes mind maps and different kinds of diagrams, like tape diagrams. With MindOnMap, you can use its easy-to-use features to make tape diagrams that help you learn better and solve problems more easily.
Main Features
• It is super easy to use, so you can quickly make and change your tape diagrams.
• You can tweak the look of your diagrams by changing the bars' colors, labels, and size to show different amounts.
• It lets you work on the same diagram simultaneously with friends or classmates.
• You can send it out in different formats (like PDF or images) to share with others for school projects or presentations.
• Since it's online, you can use it from any device with an internet connection, making it handy and easy.
Secure Download
Secure Download
Steps to Create a Tape Diagram on MindOnMap
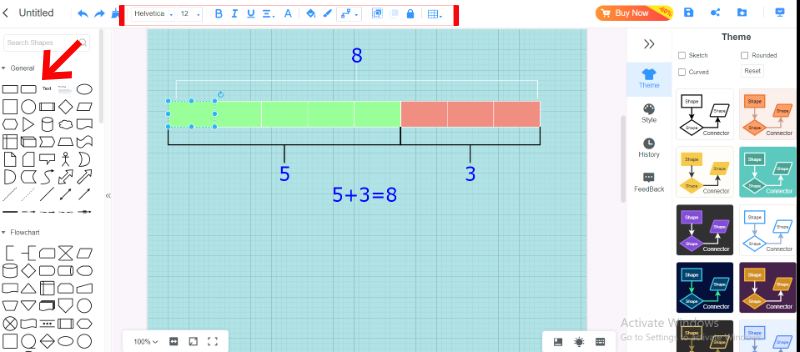
Access MindOnMap by signing in with your account or creating a new one if you are a new user. From the dashboard, click on the Flowchart to create a new diagram.
Use the general toolbar to add rectangular bars representing different quantities in your tape diagram. Click on each bar to add labels describing the quantities or parts they represent. Use the customization options to make the diagram's colors, fonts, and other visual aspects more engaging.
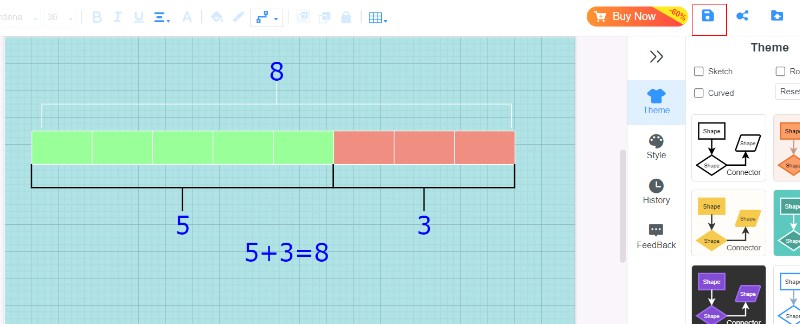
Check the diagram for accuracy and make any necessary adjustments. Once the diagram is complete, export it in your desired format or share it with others using MindOnMap’s sharing features.
MindOnMap can be a fun way to make diagrams with lines and shapes. It is the best choice for customized diagrams and small projects.
Method 2. EdrawMax Online
EdrawMax Online is a tape diagram maker and a powerful tool for creating diagrams with many different templates, shapes, and customization options. Although it's not made just for tape diagrams, its flexibility makes it a good choice for creating these visual guides.

Key Features for Making Tape Diagrams with EdrawMax Online
• It has some pre-made templates you can use as a starting point for your tape diagrams.
• The tool comes with various shapes and symbols that you can use to show different parts of your tape diagram.
• You can tweak your tape diagram by changing colors fonts, and adding labels.
• It lets you share your tape diagrams in different formats with others.
Method 3. Boardmix
Boardmix is a tape diagram maker and a team-friendly whiteboard app that lets you create and share all sorts of diagrams. Although it's not made just for tape diagrams, you can tweak its settings to create visual guides.

Key Features for Making Tape Diagrams with Boardmix
• The big whiteboard canvas allows you to draw and play with tape diagrams.
• It has all sorts of shapes and lines to show off your tape and its sections.
• Write out each part of your tape diagram.
• Pick out any colors you want to make your tape diagram look how you like.
• It is for people to work on the same diagram simultaneously.
Boardmix's teamwork features make it a good choice for group projects or working from home. But if you need to create specific tape diagrams, use MindOnMap.
Part 6. FAQs About Tape Diagram
What is a tape diagram ratio?
A tape diagram ratio is a picture that shows a ratio using a bar model. A ratio is a way to compare two or more numbers and show how they're related. The number ratio in the bar or tape and the size of the bar determines how much that number is worth.
Why are they called tape diagrams?
The word tape diagram probably comes from using strips of tape or paper to show amounts. The strips can looked at to see how different numbers are related. Thinking of it like tape or paper strips makes it easier to picture how you compare amounts using something you can touch and see.
Is a tape diagram the same as a bar model?
Yes, a tape diagram is just like a bar model. They both mean the same thing. A visual tool that uses rectangles or bars to show amounts and how they're related. You can also call it a tape diagram, a bar model, or a strip diagram; they all mean the same thing.
Conclusion
Tape diagrams math are super handy visual aids that make complicated math ideas easier to get. They help show how different numbers or amounts are related, making it simpler to figure out problems and get the hang of ratios, fractions, and other math. Tools like MindOnMap, EdrawMax Online, and Boardmix make making these diagrams a breeze, letting you customize them to fit any problem or teaching style. In the end, tape diagrams aren't just for school. They're handy tools anyone can use to grasp better or explain math relationships more clearly.