The Art of Problem-Solving: Examples Of A Tape Diagrams
Tape diagrams, also known as bar models, are invaluable in visualizing mathematical relationships and simplifying the comprehension of word problems. They clarify complex concepts and make math more accessible. Using simple visuals and tape diagrams helps us understand math. They make complex ideas easy to grasp. This article will explore tape diagram examples and their uses in math. We will discuss how to build and read these diagrams. They are useful for solving many word problems, from basic math to advanced topics.

- Part 1. Tape Diagram Example
- Part 2. Tape Diagram Templates
- Part 3. Best Tape Diagram Make: MindOnMap
- Part 4. FAQs about Tape Diagram Example Template
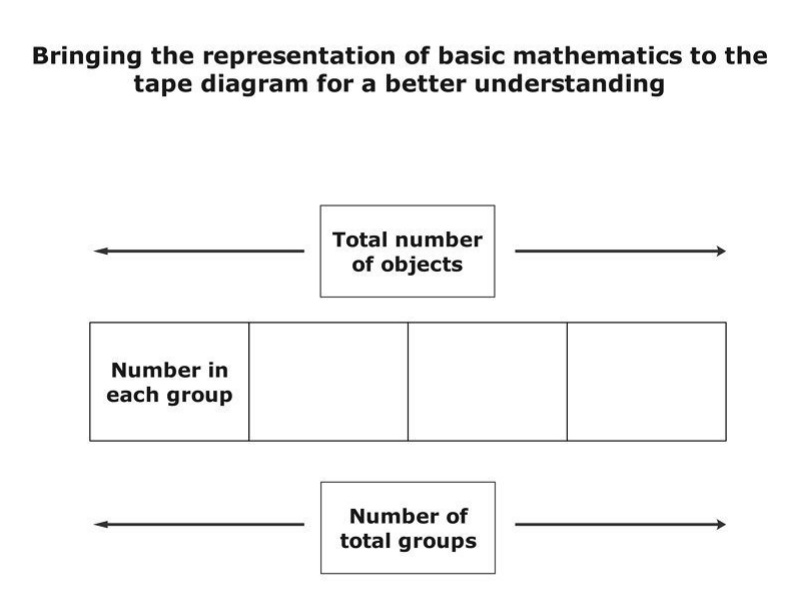
Part 1. Examples Of A Tape Diagram
Example 1. Number of Boxes
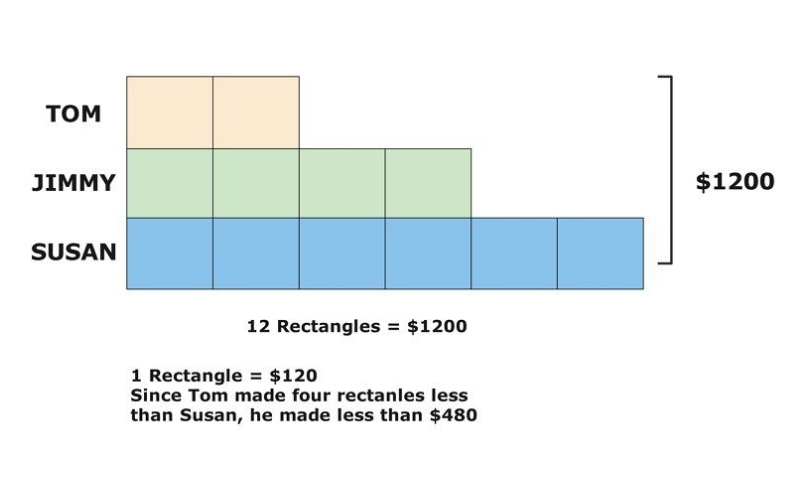
The example provided showcases a comparison of how much money each person has earned, depicted through the number of boxes they possess. Tom represents the two boxes, Jimmy has three, and Susan has five. Their combined earnings amount to $1200, visually highlighted by brackets surrounding the tape diagram. Each box or rectangle within the diagram symbolizes $120. The tape diagram presents a simple yet effective method for tackling mathematical problems. It delineates how earnings are distributed among individuals, making it an excellent instrument for such calculations. This technique facilitates accurate computations of ratios.
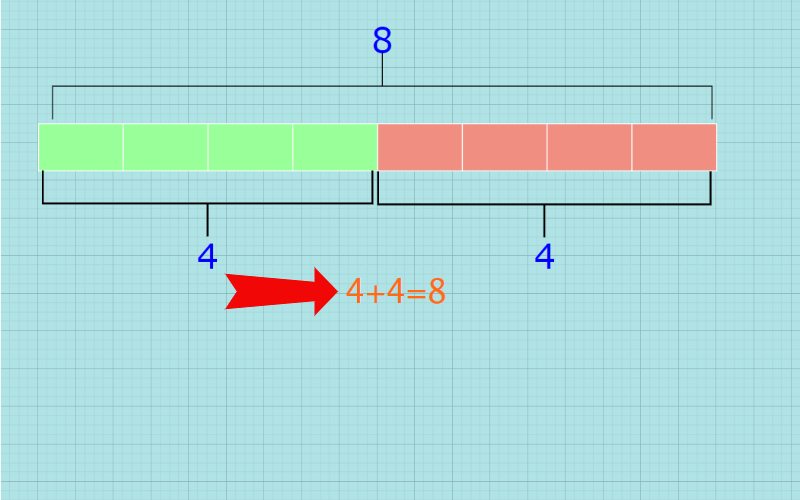
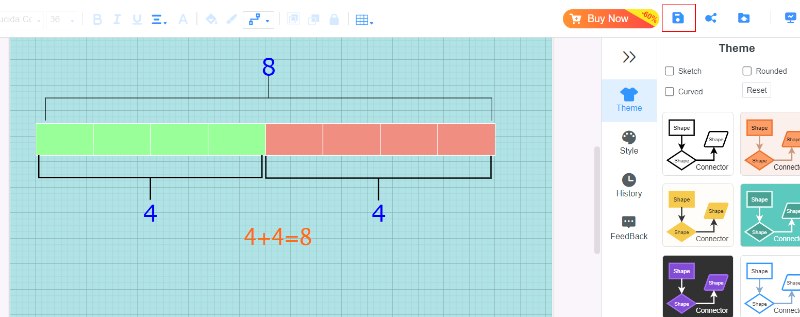
Example 2. Simple Math Problems
Create a tape diagram example that represents each equation.
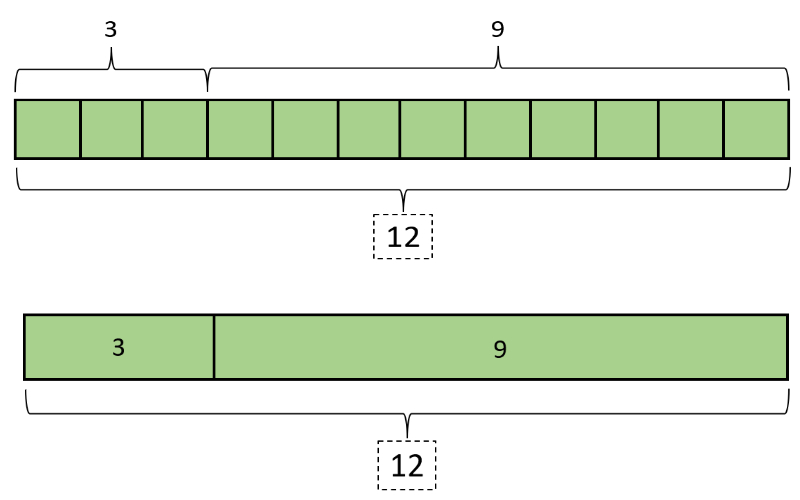
( a ) 3 + 9 = 12
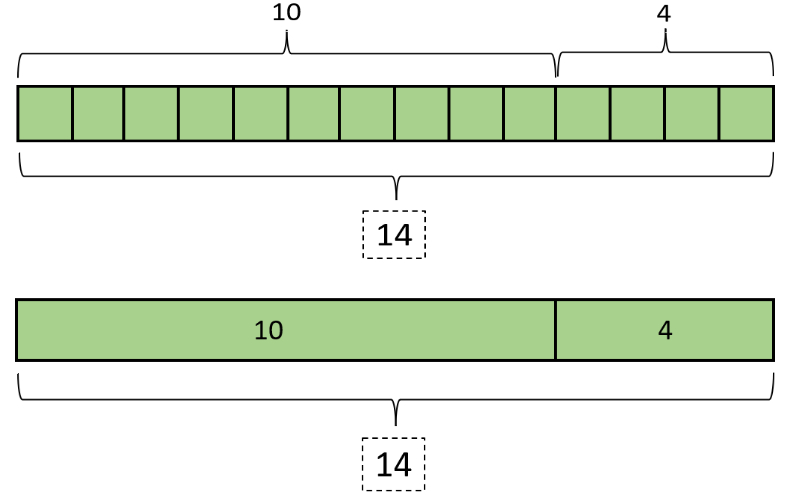
( b ) 10 + 4 = 14
Solution
(a ) To create a tape diagram for 3 + 9 = 12, we must make three equal cells and nine more. An alternative illustration would be a rectangle with two parts, as shown below. Notice that the rectangle for 9 is longer than that of 3.
(b ) To create a tape diagram for 10 + 4 = 14, we must make ten equal cells and four more. An alternative illustration would be a rectangle with two parts, as shown below. Notice that the rectangle for 10 is longer than that of 4.
Part 2. Tape Diagram Templates
With this visual model, students can effortlessly tackle mathematical problems by gaining a bird' s-eye view through comparative equations. Here’s why you should consider using a template, especially for the students.
Easy to See: Tape diagrams make it clear and simple to see how math is connected, helping you solve those tough problems.
How to Solve Them: These diagrams are a great way to get better at figuring things out.
Do Whatever You Need to: You can twist them to fit any math idea, which means they're great for every age level and subject.
Keep Everything Organized: They help you sort out your thoughts and see how to break down a problem step by step.
Fun and Interesting: Because they're all about visuals, doing math with these diagrams can be way more fun and exciting.
Helps Everyone Learn: If you learn best by seeing, by listening, or a bit of both, these diagrams help you visualize the math.
Work Together: Using these diagrams can facilitate chat and collaboration if you're in a group.
Check Your Work: Your teacher can use them to see if you get it. Useful and Cool at the Same Time.
Steps In Doing A Tape Diagram Template
Online: Use apps like Microsoft Word, Google Docs, or Canva to create an online template for easy editing and sharing.
Use rectangles to represent quantities or issues. Name your rectangles. Highlight how numbers change by using arrows.
Use lines to aid in measuring and alignment. Use different colors to differentiate numbers or connections. Adjust the size of rectangles to represent different amounts or groups.
Create a space for students to write down their formulas or equations and provide areas for students to write their answers.
Part 3. Best Tape Diagram Make: MindOnMap
MindOnMap is a top online tool for turning your thoughts, ideas, and projects into clear, attractive visuals. It's great for organizing, planning, and simplifying complex problems with mind maps, flowcharts, and diagrams. It's used by many, including students, teachers, professionals, and teams because it's easy to use and makes complex information simple with clear diagrams. MindOnMap is simple, even for beginners, and has features like real-time collaboration, templates, and accessibility from any device, making it appealing. It's a must-have for making blank tape diagram templates, understanding concepts better, and sharing ideas effectively. Whether you're using it for personal projects, school work, or team projects, MindOnMap makes organizing and visualizing your information easy.
Secure Download
Secure Download
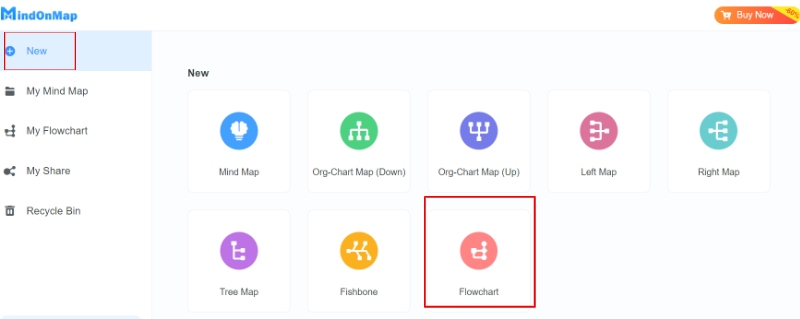
Search MindOnMap in the search engine. You can download or use it free online. Arrange your data. Make sure you know what numbers or values you're dealing with, and choose the Flowchart.
Choose a big rectangle or line to show the total amount. Break it down into smaller sections to show the different parts. You can change the colors and themes. After that, you can use brackets to separate it.
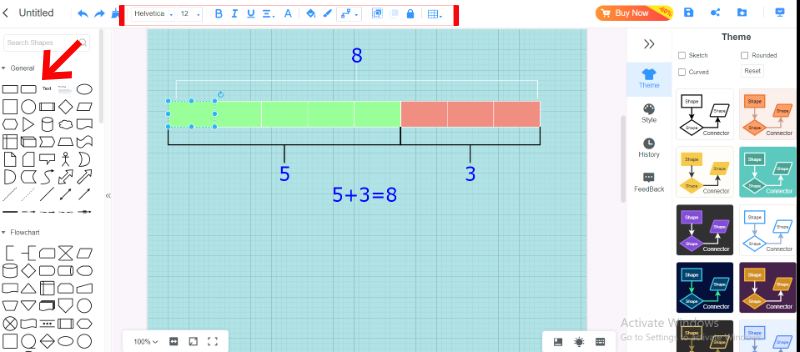
Label your data and create a formula to sum it up.
Once you've reviewed all the information and possible fixes, click Save to save your project.
Part 4. FAQs about Tape Diagram Example Template
Is a strip diagram the same as a tape diagram?
Yes, a strip diagram is the same as a tape diagram. Both visual tools represent mathematical relationships and solve problems. Strip and tape diagrams work interchangeably to describe these rectangular models. Their design makes numbers easier to see and work with, helping us better understand and solve math problems.
How do you do a tape diagram for division?
To make a tape diagram for division, determine the total amount and the numbers divided. Next, draw a rectangle and write the total amount on it. Then, split the rectangle into equal sections, making sure there are as many sections as the number you're dividing by. Label each section with the division result. This method helps you understand how the total, the number you're dividing by, and the result of the division are related.
What is a tape diagram in 6th-grade math?
In 6th grade math, a tape diagram helps make sense of and solve problems by visually showing quantities, ratios, and equations. Students can use it to tackle word problems by simplifying them, grasp fractions better, and solve equations by seeing the math connections more clearly. It also simplifies learning ratios and proportions.
Conclusion
Making tape diagram templates makes math easier by simplifying complex concepts visually, aiding in understanding numbers, and solving various math problems. Templates cover basic arithmetic to advanced topics like equations and ratios, and using them simplifies the process for students and teachers alike. The MindOnMap tool offers versatile features for creating and modifying diagrams. Their benefits include enhancing problem-solving skills, improving math comprehension, and fostering collaboration. Incorporating tape diagrams in teaching and learning can boost students' math understanding and confidence in tackling problems.