Uncovering the 5 Best Plot Chart Makers to Simplify Storytelling
Plot diagram makers are like special tools that help us understand stories better. To show important parts of the story, we can use them to put pictures or words. These tools make it easier to see how a story is put together. Yet, there are many tools available, and it could be challenging to find the perfect one. So, in this discussion, we have provided a review of the best plot chart makers. At the same time, you’ll learn how to do a plot diagram.

- Part 1. Best Plot Diagram Maker
- Part 2. Microsoft PowerPoint
- Part 3. Lucidchart
- Part 4. Plot Diagram Generator (Online Tool)
- Part 5. Canva
- Part 6. FAQs About Plot Diagram Maker
As one main writer of MindOnMap's editorial team, I always provide real and verified information in my posts. Here are what I usually do before writing:
- After selecting the topic about plot diagram maker, I always do a lot of research on Google and in forums to list the software that users care about the most.
- Then I use all the plot chart makers mentioned in this post and spend hours or even days testing them one by one.
- Considering the key features and limitations of these plot diagram creators, I conclude what use cases these tools are best for.
- Also, I look through users' comments on the plot diagram maker to make my review more objective.
| Plot Diagram Maker | Ease of Use | Usability | Supported OS Platform | Output Quality | Price |
| MindOnMap | Easy to Moderate | Average | Web-based, Windows, Mac, Linux | High | Free |
| Microsoft PowerPoint | Easy | Good | Web-based, Windows, Mac | High | Microsoft PowerPoint only – $109.99; Microsoft Bundle – $139.99 |
| Lucidchart | Moderate | Average | Web-based | High | Free; Individual – $7.95; Team – $9.00/user |
| Plot Diagram Generator (Online Tool) | Easy | Good | Web-based | Moderate to High | Free |
| Canva | Easy to Moderate | Good | Web-based | High | Teams (Up to 5 people) – $29.99; $14.99/month; – $119.99/annually |
Part 1. Best Plot Diagram Maker
When you look over the internet, you’ll find many plot diagram makers. Yet, the tool that we highly recommend is MindOnMap. It is a web-based program that allows you to create diagrams based on your needs and preferences.
MindOnMap is considered one of the best plot diagram creators because of its unique capabilities and features. It will help you take your storytelling to a whole new level. It also simplifies the process of organizing and connecting plot points, events, and characters. With it, you can create detailed diagrams that will assist you in visualizing the entire story structure. Apart from being a plot diagram maker, you can utilize it for other visual presentations. It offers templates such as fishbone diagrams, tree diagrams, organizational charts, and so on. What’s more, you can also insert links and pictures with your work. You can also choose your desired shapes, lines, color fills, and more.
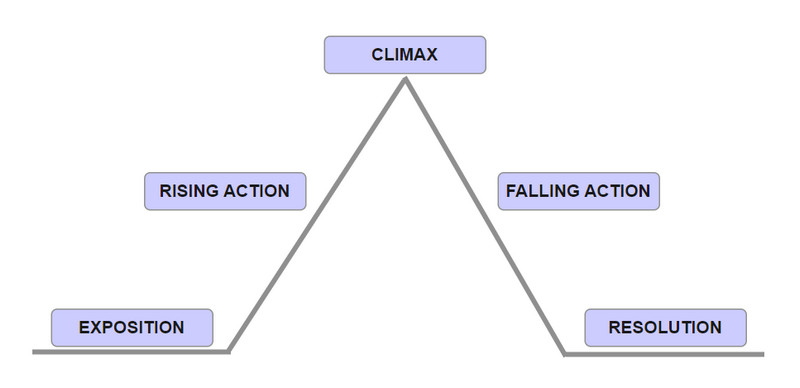
Get a detailed plot diagram maker.
PROS
- Offers an easy-to-use interface.
- Freedom to customize diagrams with different shapes, texts, themes, and more.
- Allows real-time collaboration.
- Provides multiple export choices, such as PDFs and image files.
- Available on Mac and Windows.
- Accessible both online and offline.
- A plot diaphragm software that has an auto-saving feature.
CONS
- Though it is a user-friendly tool, some first-timers require time to fully grasp the tool’s capabilities and features.
Steps to Create a Plot Diagram via MindOnMap
Firstly, go to the official website MindOnMap. Then, choose whether to Create Online or Download the tool on your Windows/Mac computer.
Secure Download
Secure Download
In the following interface, choose the Flowchart option among the functions.

Now, begin personalizing your diagram by choosing shapes and adding text to show the plot you desired.
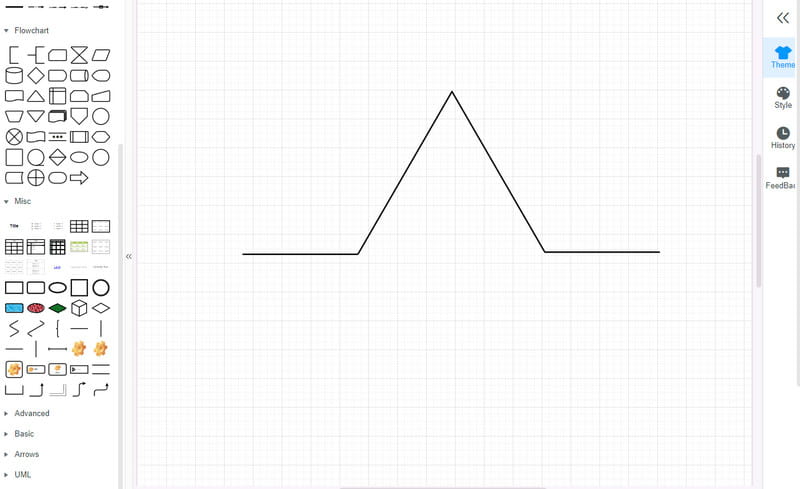
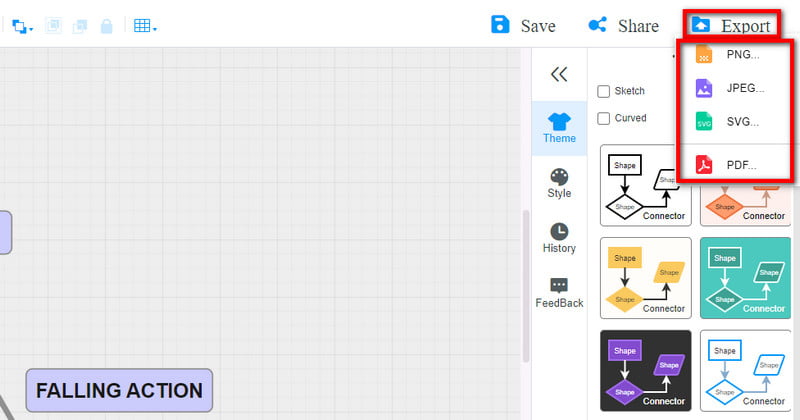
Once you’re done and satisfied, save your work. To execute the process, click the Export button and choose the output format you want. Wait until the procedure is finished.
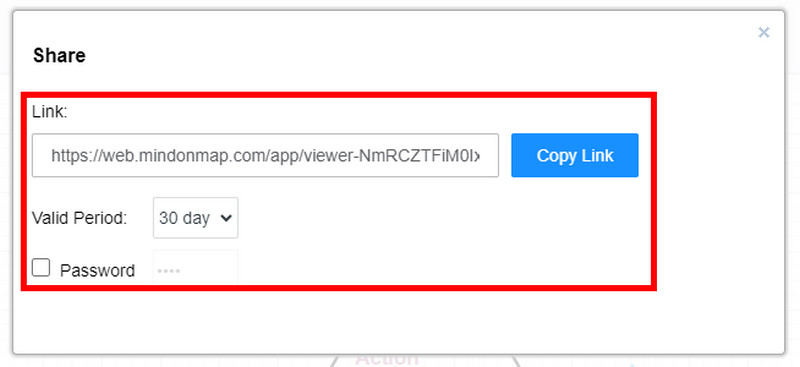
Also, you can click the Share button and Copy Link to share it with your peers, colleagues, and others. Optionally, you can exit your work if you aren’t finished with your diagram. The tool will save all the changes you’ve made so you can open and edit again later.
Part 2. Microsoft PowerPoint
Microsoft PowerPoint is a popular presentation tool that you can also use to create your own plot diagram. You can use it to make a plot diagram from scratch. It also offers creative control, which is suitable for users who like a more hands-on approach to design. Since it is widely used, you have an idea of how to use it.
PROS
- Familiar software for many users.
- No need for software installations or additional accounts.
- Complete customization and formatting control.
CONS
- Requires more manual effort compared to other tools created as a diagram tool.
- Since you’ll start from scratch, it could consume the user’s time.
How to Make a Plot Diagram on PowerPoint
First and foremost, open the Microsoft PowerPoint on your PC.
Next, you can choose from the provided templates and themes or select the Black Presentation.
On the slide, start constructing your diagram. Add shapes, lines, and text boxes to make your plot diagram. Customize and format the diagram according to your preferences with the built-in features.
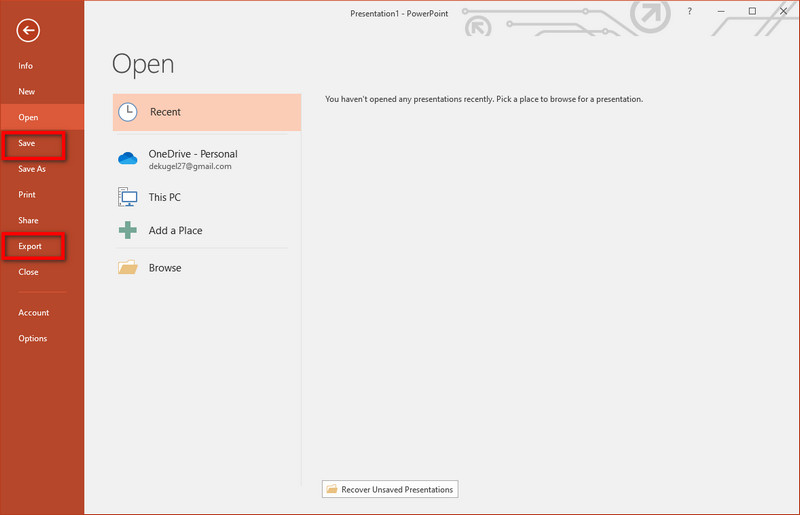
When you’re done, click the File on the upper menu tab. Finally, Export or Save your plot diagram as an image file or presentation.
Part 3. Lucidchart
Lucidchart is another way to make clear and organized visual presentations of your story plot. With it, you can draw, drag, and drop shapes and lines to highlight the components of your narrative. This plot diagram tool also provides extensive templates and customization options. Although it excels in making a diagram, it is not specifically designed for storytelling. Thus, you may need to adapt it for your plot diagram necessities. Know more about this below.
PROS
- Offers a comprehensive set of diagramming options.
- Provides a collaboration option for group projects.
- The free version is available.
CONS
- Some advanced features and extensive collaboration features need a paid subscription.
- Beginners might find the tool challenging to use.
- Difficult learning curve.
How to Make a Plot Chart using Lucidchart
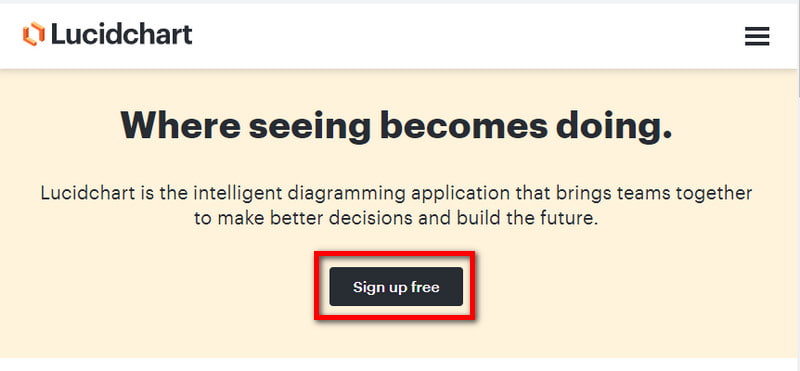
Begin by heading to the official website of Lucidchart. Next, sign up for a free account.
Next, select a blank template and customize your diagram. Add shapes, lines, and texts you want to see in your plot diagram.
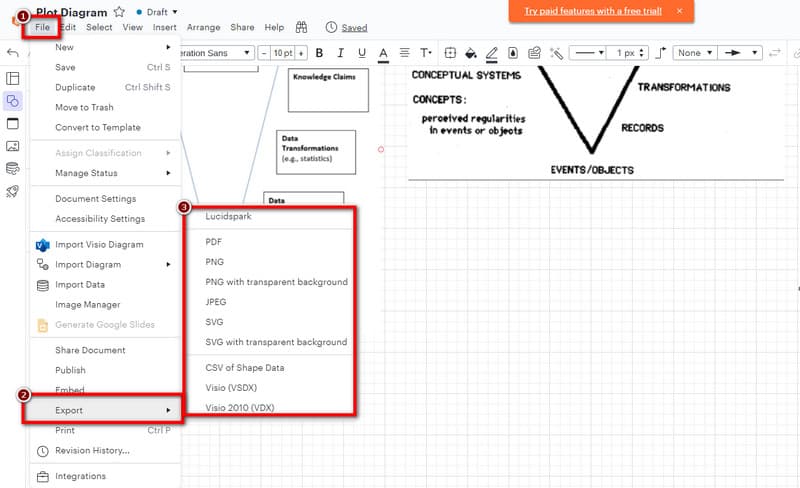
When you have completed personalizing the diagram, hit the File button on the upper-left menu. Finally, click the Export option from the drop-down menu and choose your desired output format. That’s it!
Part 4. Plot Diagram Generator (Online Tool)
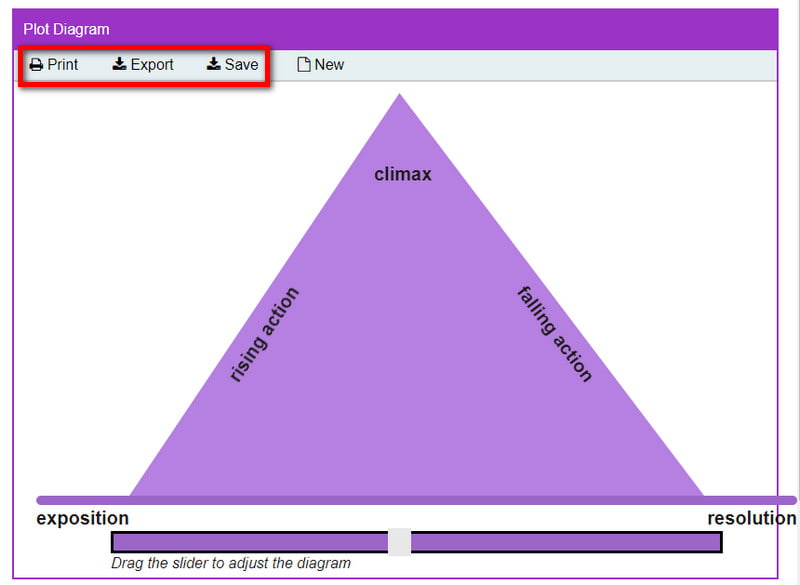
Plot Diagram Generator by ReadWriteThink is an online tool primarily designed for educational purposes. It helps writers, educators, and students to make a story’s structure visual representation. Also, it is a straightforward story plot diagram maker for free. Creating a visual aid makes it easier to analyze and understand the plot of a story or narrative. This plot diagram generator supports both Freytag’s and Aristotle’s concepts of plot structure.
PROS
- Designed specifically for educational use.
- Free and does not require creating or signing up for an account.
- Offers an easy-to-use and easy-to-understand tool.
CONS
- Limited in terms of customization choices.
- Designed for educational use only, resulting in a lack of advanced features.
Steps on How to Use Plot Diagram Generator
To start with, visit the ReadWriteThink Plot Diagram Generator website. From there, click the LAUNCH THE TOOL button.
Afterward, you can open a saved diagram by clicking the File Chosen. Or hit the Next button to just fill in the required details for your plot diagram. Input information such as the Project Title and By (created by who).
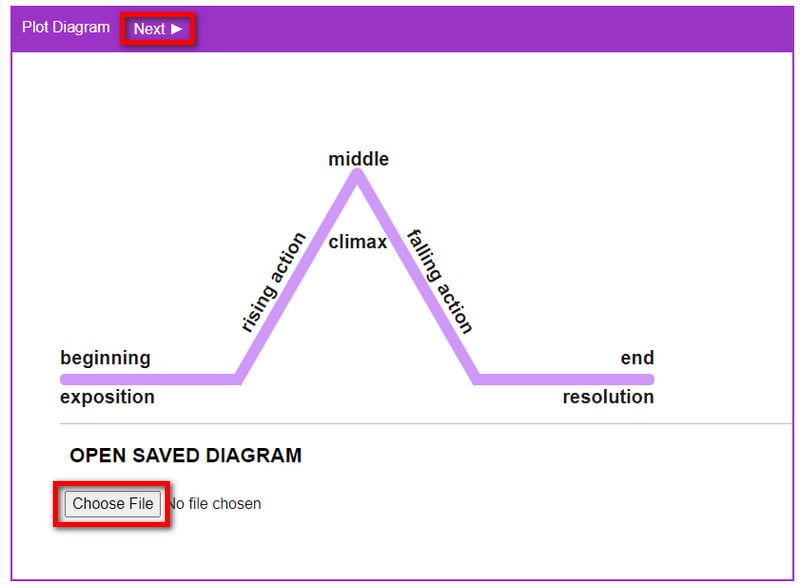
Then, you can also choose the Triangle Labels based on your needs. Next, hit the Next button.
Optionally, you can drag the slider below to adjust the diagram based on your desired output. Finally, click the Print, Export, or Save button, and you’re done!
Part 5. Canva
Canva is another well-known platform used for making various content, including plot diagrams. An online plot diagram maker that also offers extensive features and options. With Canva, you can choose a wide variety of templates, letting you craft an organized diagram as well. You can also add shapes, texts, lines, and images to make your diagram more personalized. Apart from that, you can make presentations, wallpapers, videos, logos, etc., using it.
PROS
- Offers an intuitive interface with drag-and-drop functionality.
- Abundant customization tools and design options.
- It is a cloud-based tool, accessible from any device with an internet connection.
CONS
- Some advanced features require a Canva Pro subscription.
- Extensive design elements and choices can be overwhelming for users who prefer a more straightforward way.
How to Make a Plot Diagram with Canva
Before anything else, visit the official webpage of Canva and sign up for an account.
Once you’re done signing up, on the tool’s search bar, type for plot diagram. Then, you’ll find templates you can use for your plot chart.
Now, select a template and customize it by adding your story’s plot details. Alternatively, you can make your own template and personalize it using the Whiteboard option.
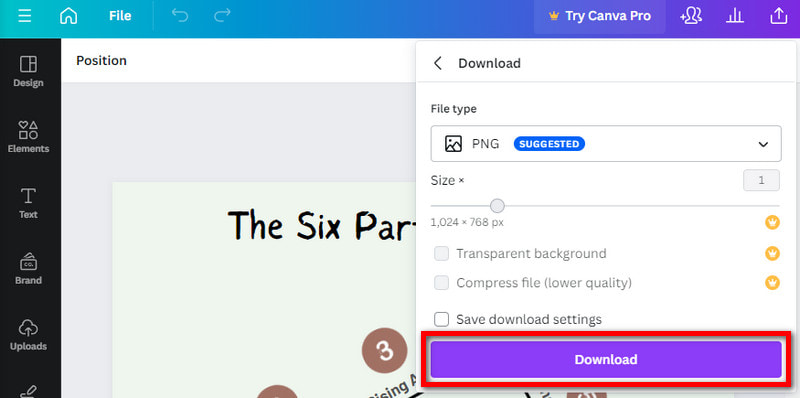
After that, hit the Share button and choose Download. Then, choose your desired file type. At last, click Download and wait until the process is finished.
Part 6. FAQs About Plot Diagram Maker
How do you make a plot diagram?
To draw a plot diagram, identify first the key components of your story. Next, create a chart with labeled sections for each component. Finally, fill in the sections with details from the story to represent the plot’s progression.
What is a plot diagram template?
A plot diagram template is a premade layout that offers a visual framework for making a plot diagram. A template is labeled sections for each element, allowing you to input the details of your story.
What is a plot diagram 4th grade?
It involves teaching students how to comprehend and create simple diagrams for basic stories. It focuses on introducing them to the fundamental elements of a story's plot.
How to make a plot diagram in Excel?
To make a plot diagram in Excel, you can use shapes or text boxes to create the elements. Add the exposition, rising action, climax, falling action, and resolution. You can also add lines to connect them and customize the design as needed.
How to make a plot diagram in Word?
To create a plot diagram in Word, you can use shapes, text boxes, or tables. Arrange and label these elements, like exposition and climax. At last, use lines to connect them as required.
How to make a plot diagram on Google Docs?
In Google Docs, you can create a plot diagram by using the Drawing tool. Insert shapes, lines, and text boxes to represent the different parts of the plot. Finally, position and label them accordingly.
Conclusion
To sum it up, plot diagram makers are like your storytelling helpers. They show you the important parts of a story so you can understand it better. Yet, choosing the best tool allows you to create your desired diagram. With that, we highly suggest you use MindOnMap. It has a straightforward interface that is perfect for beginners and professional users. It will also serve as a handy software for your diagram needs.


