How to Create a Funnel Chart in PowerPoint and Alternative
One of the greatest methods for graphically representing a variety of facts and details is the funnel diagram, often known as a funnel chart. This medium is useful. They can be a great help for your business presentations and are unquestionably a big upgrade over text-heavy slides. In line with that, following our simple instructions, you will quickly learn how to create a funnel diagram in PowerPoint. As an addition, we will give you an extra way to make it an easier version. Alright, for that let us get started!

- Part 1. How to Create a Funnel Chart in PowerPoint
- Part 2. Pros and Cons of Using PowerPoint to Make Funnel Chart
- Part 3. Alternative Way to Create How to Create a Funnel Chart in PowerPoint
- Part 4. FAQs about How to Create a Funnel Chart in PowerPoint
Part 1. How to Create a Funnel Chart in PowerPoint
It's quite simple to create a funnel chart with PowerPoint! They can be made in a variety of methods. But now, observe the typical methods for creating one: The Shape Features and The SmartArt Feature.
Method 1: Add Shape
The first method we can use in PowerPoint to create a Funnel Chart is to add shapes. This section outlines the steps we need to take to create a Funnel Diagram. These methods show PowerPoint’s uniqueness in terms of creating funnel charts compared to other tools like Google Sheets or Microsoft 260. Please follow these steps now.
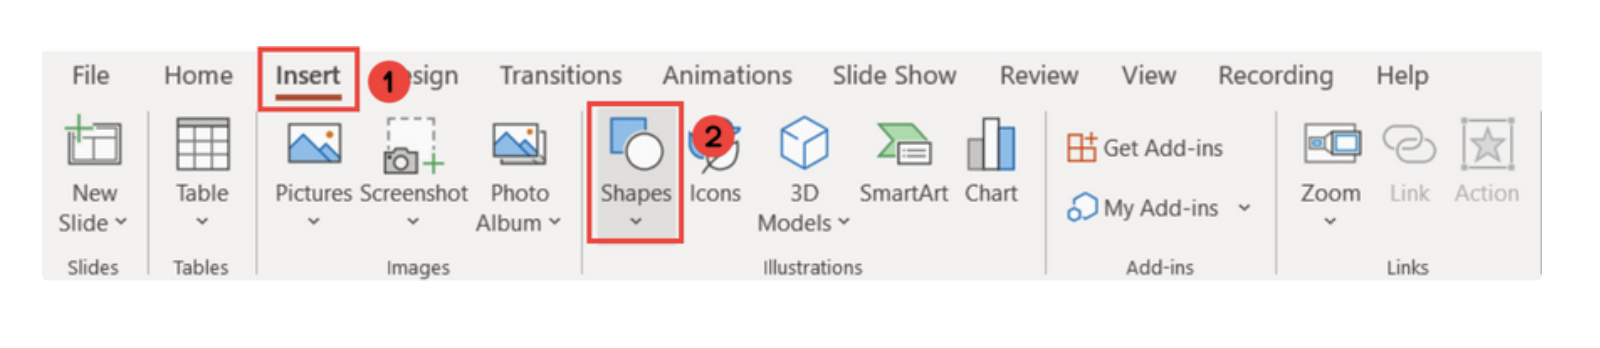
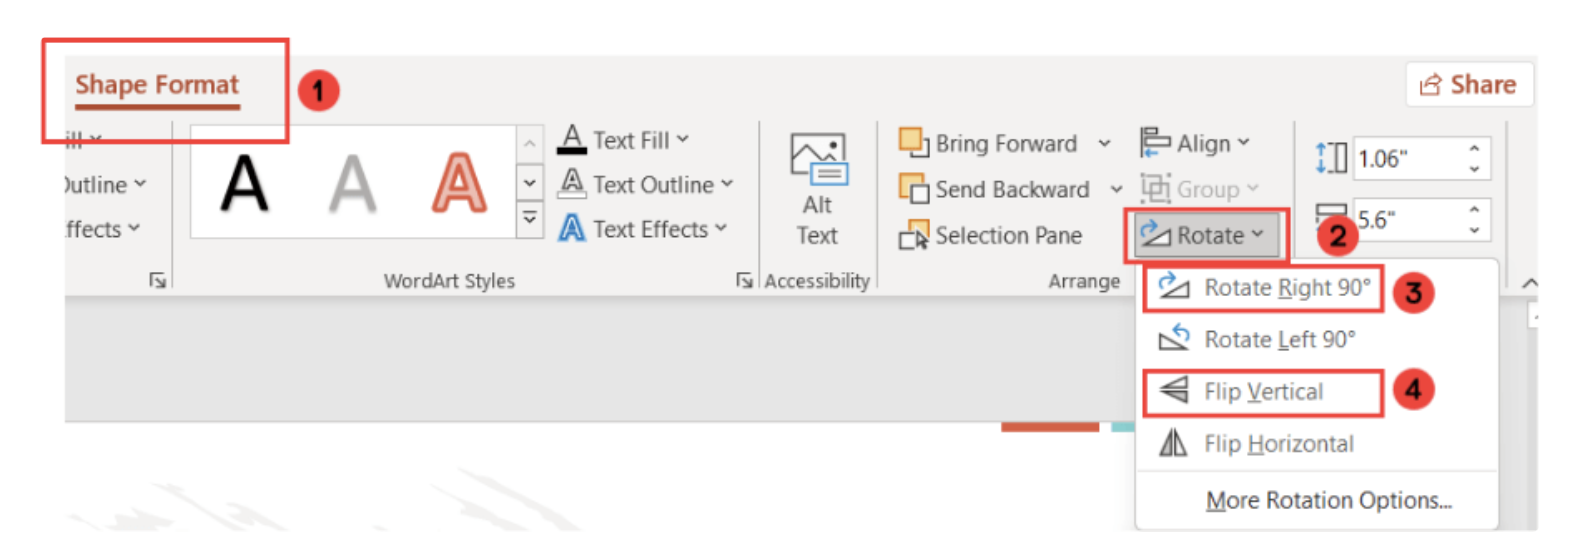
Open PowerPoint on your device and create a new presentation. Then, select Shapes from the Insert tab to insert a trapezoid shape.
Now, it must be rotated so that the narrower part faces downhill. Next, we need to select Rotate from the Shape Format Tab and then click Flip Vertical.
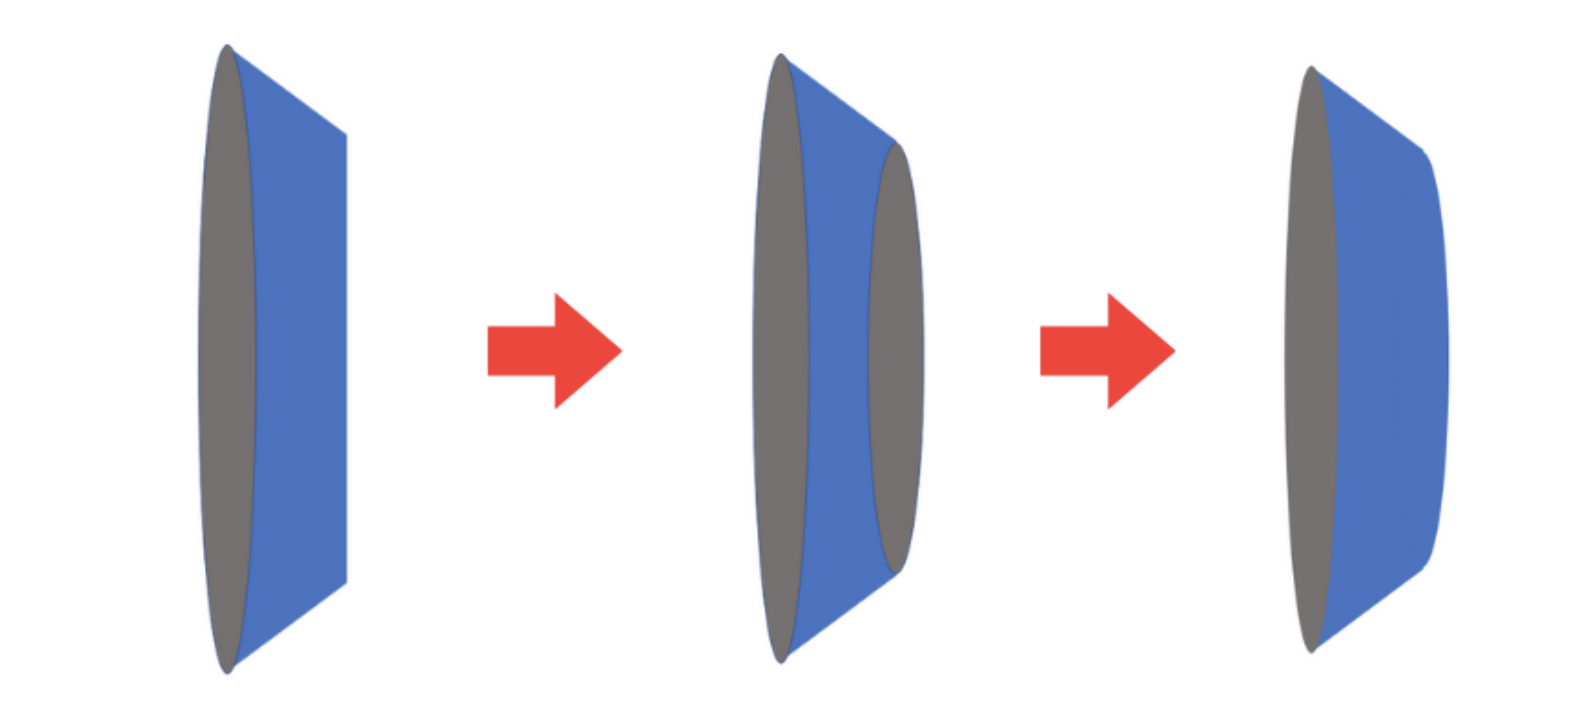
Following that, we ought to be able to see an inverted trapeze at this stage. Check the shape now.
After that, kindly pick the shape you made and hit Ctrl+D to make as many copies of the shape as there are levels. From here, please choose the color you want for them, then reposition and adjust them to form a funnel-like shape. This is what the outcome will resemble. Please see the photo below.
Adding shapes to PowerPoint presentations is a great way to make a funnel diagram in your PPT. We only need to remember that we need to ensure the proper alignment of the shapes to have a great diagram. If you think this might require an effort, then see the second method.
Method 2: Use SmartArt Feature
In the next method, we have a great feature called SmartArt. This is a common feature that users use to create visual presentations such as Funnel Charts. Let's see how we can use it. Please follow the steps below.
On our PowerPoint presentation, please select SmartArt by clicking on the Insert Tab.
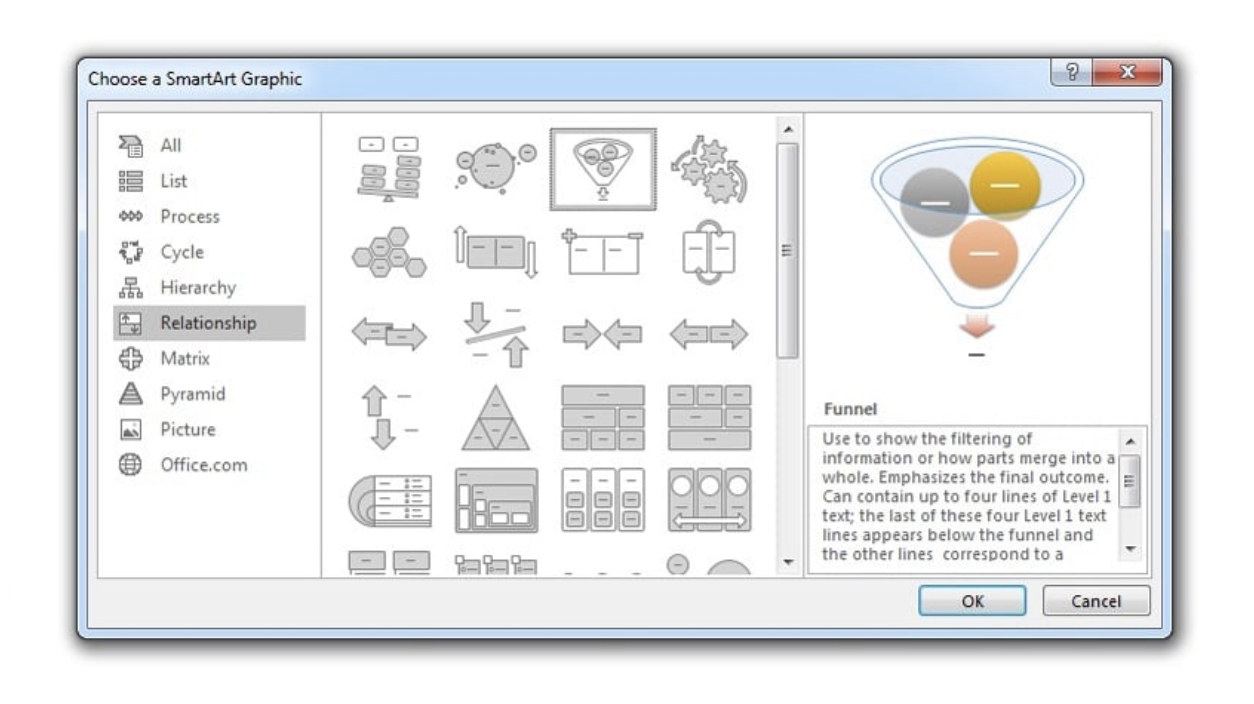
Now, we need to select the section on relationships. Then, to include the funnel diagram in your presentation, pick it and click OK.
Your presentation will now have a funnel graphic added to it and a bulleted text box with text next to it. The first three bullet points represent the objects inside the funnel, and the fourth bullet point represents the summary notion. Edit the text box to enter your stuff.
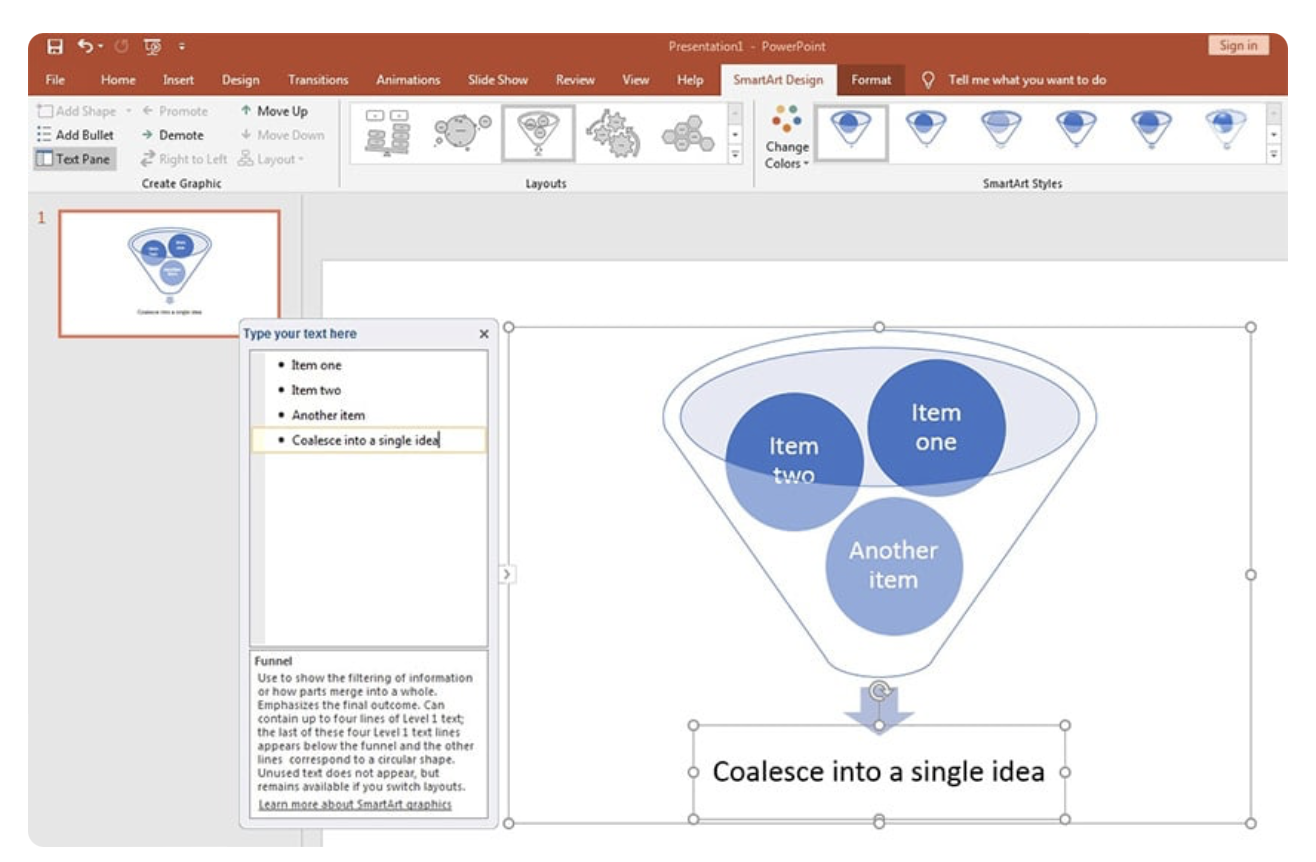
Lastly, adjust the image to reflect your logo. Under the SmartArt Design option, choose Change hues to alter the hues.
Indeed, SmartArt is much more professional to use and easy to create a funnel chart in PPT. This is a much easier and time-saving process compared to the first method.
Part 2. Pros and Cons of Using PowerPoint to Make Funnel Chart
PROS
- The tool provides a range of forms, hues, and designs.
- Easily works with displays and visuals.
- There are ready-to-use funnel templates available.
- Simple editing and sharing with co-workers.
CONS
- The tool’s extremely intricate designs are less suitable.
Part 3. Alternative Way to Create a Funnel Chart in PowerPoint
We can see above that PowerPoint is a great tool for creating a Funnel Chart. However, it might need some effort to use, especially with non-tech users. With that being said, if you need an alternative, then MindOnMap is the one you are looking for. This tool helps users to create different diagrams and charts simply. This tool offers every element you need in presenting the details you want to convey in a Funner Chart.
Secure Download
Secure Download
In addition, MindOnMap can provide high-quality results with clear visuals, similar to PowerPoint. Therefore, MindOnMap is a great alternative to PowerPoint because it offers every feature we need in a much easier way. Get it now and see how we can use it.
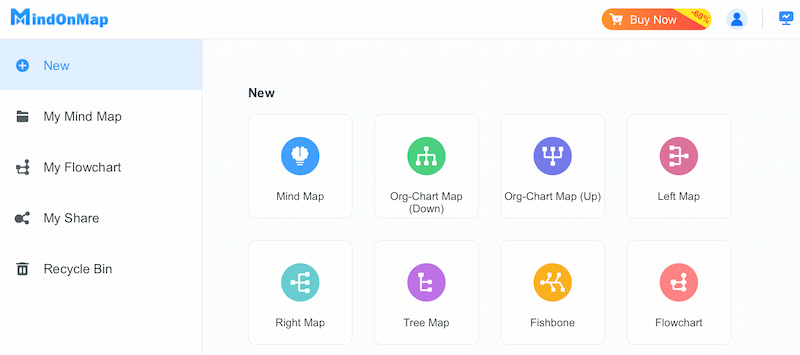
Open the incredible MindOnMap on your computer and choose Flowchart under new portions.
We can now add Shapes to build the funnel chart we need. It is recommended to use a Trapezioid and a Triangle at the top for symbolism. Arrange them from the highest percentage to the lowest percentage. After that, add label each shape via text.
Now, finalize the Funnel Chart by changing the them and styles. Then, please click the Save button to finish the process.
We can see the simplicity of making a chart using MindOnMap.In addition, this tool offers high-quality outputs, which is no doubt why it is recorded by many users. As we conclude this process, allow us to give you permission to edit this Funnel Chart template. You can use this and edit it in accordance with your preferences.
Part 4. FAQs About How to Create a Funnel Chart in PowerPoint
Where can I get a funnel chart PowerPoint template?
When making a new presentation in PowerPoint, search for a funnel chart to uncover pre-made possibilities if you’re looking for a funnel chart template. Furthermore, companies such as SlideModel and Envato Elements offer expensive layouts, whereas SlideHunter offers free possibilities.
What is the funnel design concept for PowerPoint?
The PowerPoint funnel design concept, which is typically shown as a wide top narrowing down to a smaller bottom, indicates a process that narrows data or alternatives via successive stages. Business presentations frequently utilize this style to show procedures like marketing funnels and sales pipelines.
How do you add a funnel to a slide?
You can use the SmartArt option to choose from a pre-made funnel design or manually make one by stacking trapezoid shapes to add a funnel to a PowerPoint slide. The built-in funnel chart feature, found under the Chart menu in PowerPoint 2016 and later, allows you to create a funnel by entering data straight into the tool.
How can I use PowerPoint to make a flowchart?
Using PowerPoint, add a flow chart to the slides. Then, Select the Insert tab. Choose a process flow chart, like Accent Process or Basic Bending Process, from the drop-down option located in the Process section.
Is creating Funnel Charts in flowcharts easier with Word or PowerPoint?
Word works well for straightforward flowcharts with a limited number of shapes as long as they all fit within Word's page limits. Slide limits in PowerPoint are comparable to page constraints in Word; however, for bigger flowcharts, you can utilize PowerPoint's hyperlinking features to distribute the flowchart across several slides.
Conclusion
We, therefore, conclude that PowerPoint can create mind maps like funnel charts. In addition, we found out that two features can make it for us: the Add Shapes and the SmartArt feature. Yet, some users find it very default and intimidating. That is why MinOnMind is here to help you, as it offers everything you need to have a funnel diagram. Indeed, the possibility of making a funnel chart is possible.