Guide to Create Funnel Chart and Explore Different Tools
A funnel chart is a simple way to show how a big group gets split into smaller groups at different process stages, like a funnel. Each funnel section shows a stage, and how big it demonstrates how many people or items are left over. It might be about sales, like how potential customers turn into actual sales, or marketing, which focuses on how ads perform. It could also talk about what customers go through from the beginning to after they make a purchase, hiring, from when folks apply to when they're on the job; website traffic, which shows who's coming to the site and what they're up to, and using a funnel chart makes it a lot simpler to spot and solve any problems or make things better.

- Part 1: MindOnMap
- Part 2: Canva
- Part 3: Google Sheets
- Part 4: Microsoft Excel
- Part 5: Lucidchart
- Part 6: Bonus: Create A Funnel Chart Online
- Part 7: FAQs about Funnel Chart Maker
Part 1: MindOnMap
MindOnMap is a simple online tool for making a blank funnel diagram with an easy-to-use interface. It's mainly about mind mapping, a cool way to present information. It's got some basic features for creating more specific funnel charts. You can make basic funnel shapes and add text, but you can only tweak it a bit. It's great for individuals or small groups looking for basic visualizations with little money to spend.
Secure Download
Secure Download
Rating: 3.5/5
Best for: Individuals and small teams looking for a basic mind mapping tool with pipeline funnel chart capabilities.
Price: It's free if you're okay with it; if you want to pay, it's $3.99 monthly.
Funnel Chart Features:
• You can put text and images in the different sections of the funnel.
• You can switch up the shapes, colors, and fonts of the nodes.
• You can save it as a picture or PDF
• It's safe to use.
PROS
- Easy to use
- Free version
- Simple to tweak
- Can turn graphs into images or PDFs
CONS
- It can't do as much as some other tools
- Not the best for working in a team
- Can't deal with complicated data analysis
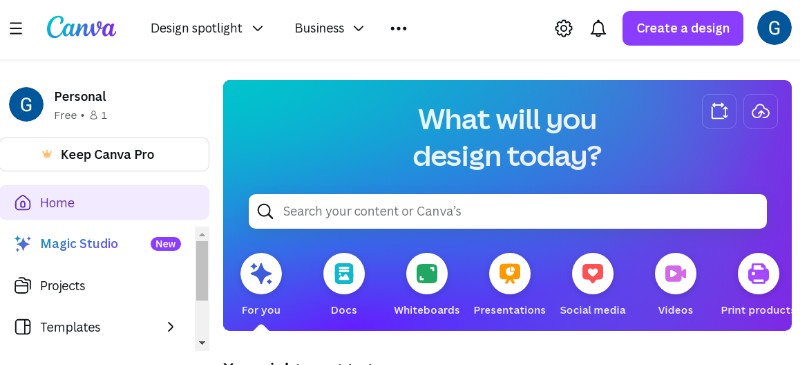
Part 2: Canva
Canva is a simple platform that offers many templates, including funnels and is famous for its cool designs. It lets users quickly change how their charts look by using different fonts, colors, and pictures. The Canva funnel chart is awesome for creating eye-catching funnel charts for presentations, reports, or social media. Still, there might be better choices for detailed data analysis or personal touches.
Rating: 4.5/5
Best for: Individuals and teams looking for a visually appealing and easy-to-use design tool with a funnel chart generator.
Pricing: No cost option with basic functionalities; subscription plans begin at $12.99 monthly.
Funnel Chart Features:
• Integration with other Canva elements (images, text, charts)
• Variety of design elements to enhance visual appeal
• Multiple export formats (image, PDF, social media)
• Strong data security measures
PROS
- User-friendly interface
- Extensive template library
- Strong focus on visual appeal
- Integration with other design tools
CONS
- It may not be ideal for complex data visualization
- Some advanced features require a paid plan
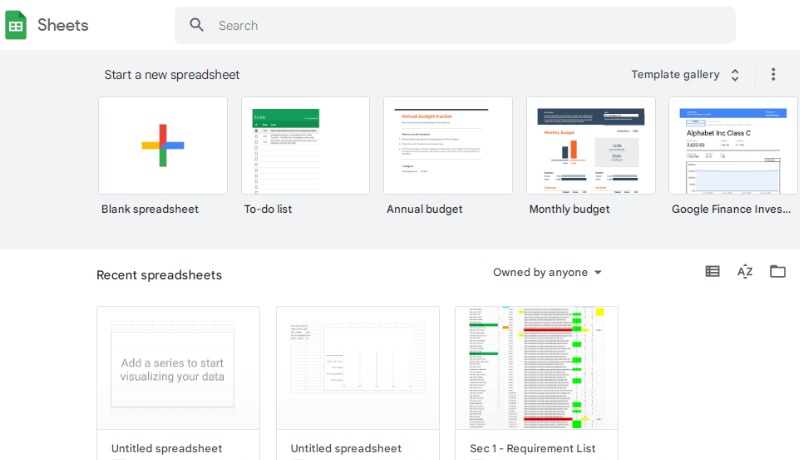
Part 3: Google Sheets
Google Sheets is a spreadsheet app that is used to analyze and change data. Thanks to its great data handling, it has a funnel chart maker feature. Users can make funnel charts directly from their data, making updates easy as the data changes. Although not as fancy as specialized design tools, Google Sheets has good features for working with and analyzing data. It's good for making interactive funnel charts with numbers and collaborating with others on the same spreadsheet.
Rating: 4/5
Best for: Data-driven individuals and teams who need to create interactive and dynamic funnel charts based on numerical data.
Pricing: Free for basic use. Affordable options for extra functionalities and more storage.
Cool Features:
• Make funnel charts straight from numbers.
• Options to style data in different ways
• Share charts in Google Workspace
• Put charts on websites or blogs.
• Strong data safety from Google
PROS
- Free for simple stuff
- Works well with Google Workspace
- Easy to move data in and out
- Lots of cool data analysis tools
CONS
- Harder to learn than tools for design
- Not as much focus on looking good
- Can't change how charts look much
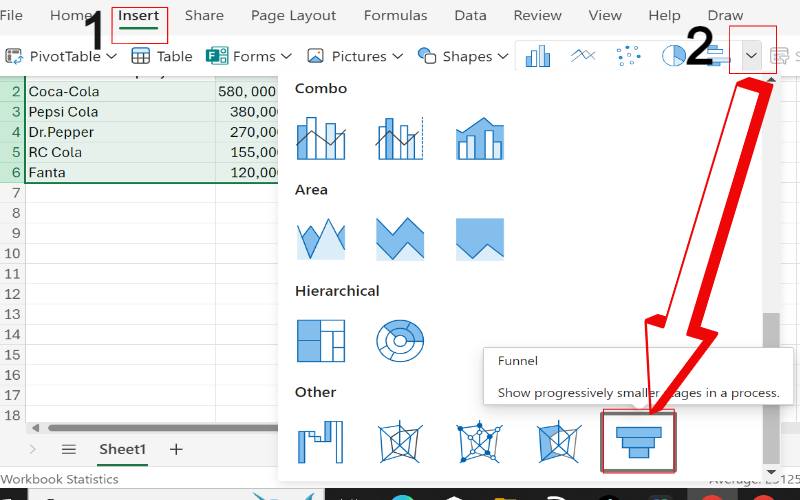
Part 4: Microsoft Excel
Like Google Sheets, Microsoft Excel is a program to create funnel chart online that look at data. It comes with a cool feature called a funnel chart for this job. Excel lets you make a funnel chart online and add details and calculations. It is perfect for people who need to be super precise with their data visuals. But it might be a bit tougher for people who like to focus on design.
Rating: 4.5/5
Suitable for: People who work with data or in business and anyone who needs to do complex data work and make it look good.
Cost: It comes with Microsoft Office, and you can buy it on a monthly plan.
Funnel Chart Features:
• Calculate conversion rates and other metrics
• Extensive customization options for chart appearance
• Embed charts in PowerPoint presentations or Word documents
• Regular updates and security patches
PROS
- Comprehensive data analysis capabilities
- Advanced customization options
- Integration with other Microsoft Office applications
- Strong data security and reliability
- Large user community and extensive support
CONS
- Steeper learning curve compared to user-friendly tools
- Requires a paid subscription
- The interface might be less intuitive for design-focused users
Part 5: Lucidchart
Lucidchart is a tool for making different kinds of charts, like funnel charts. It's good because it's flexible and helps teams work together. You can create detailed charts and share them with others. The funnel chart template feature makes charts look nice and easy to understand by mixing design and data. It's great for teams working on and changing funnel charts together.
Rating: 4.5/5
Best for: both teams and individuals, seek a tool that can do much. It's great for working together and lets you tweak your funnel charts easily.
Price: You can get a basic version for free, but if you want more, it starts at $7.95 a month.
Cool Features:
• Pre-made funnel chart templates
• Simple to move and customize
• Throw in some pictures and symbols to spruce it up
• Can all work on the same document as your team at the same time?
• Keep your info secure.
Advantages:
• User-friendly
• Great for team collaboration
• Able to create all kinds of diagrams
• Fits nicely with Google Workspace and Microsoft Teams
• Let's personalize your funnel charts.
Part 6: Bonus: Create A Funnel Chart Online
MindOnMap is mainly for mind mapping and makes a simple free funnel chart maker. However, it has few options to customize it. This is compared to other tools, like dedicated funnel chart software or general design platforms. It's simple and quick for basic funnel charts and easy to use with existing MindOnMap projects. MindOnMap is good for basic, fast, and existing project use. Still, more is needed to meet the needs of those wanting advanced customization or a visually impactful funnel chart. Dedicated funnel chart software or general design platforms are better choices.
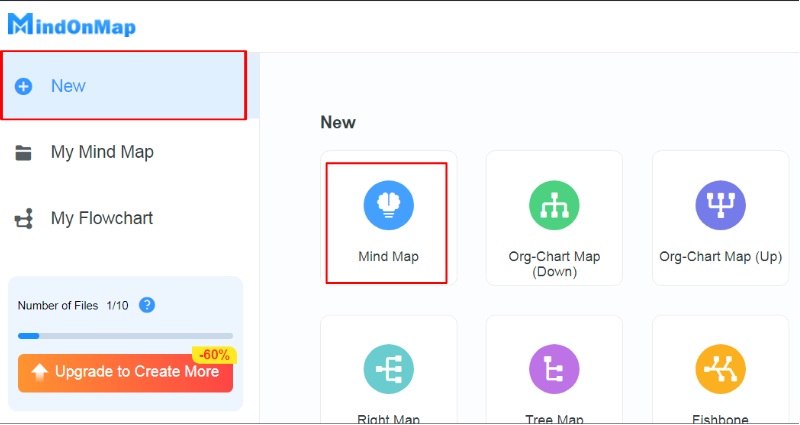
Launch your browser and search for MindOnMap in the search bar. Once you open it, create a new project to start constructing your work.
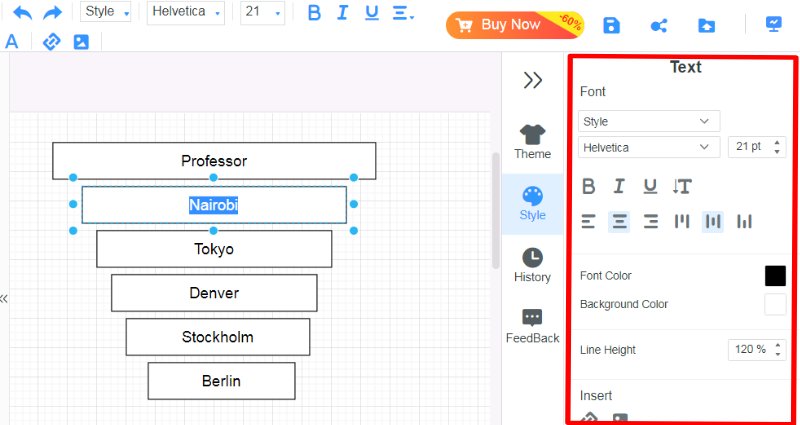
Select the Flowchart theme, select the Rectangle shape, and manually set it. You can construct it to look like a funnel.
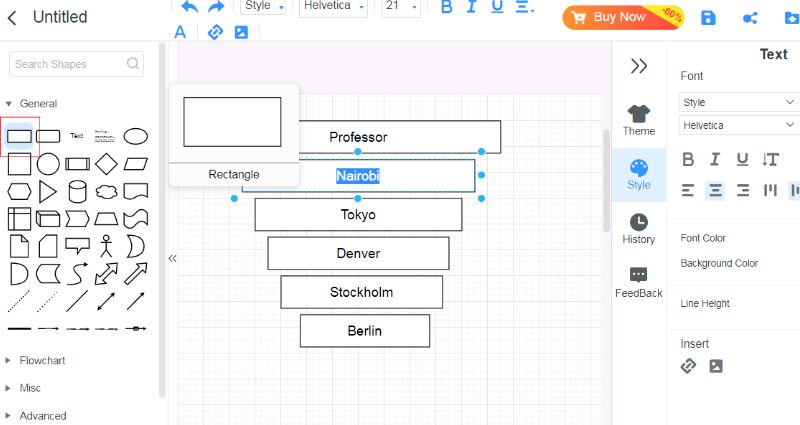
Double-click on the rectangle to enter your data. The right panel allows you to customize the text, changing its size and font style.
Part 7: FAQs about Funnel Chart Maker
What is the best way to visualize funnel data?
A funnel chart is the best way to visualize funnel data. Its shape shows the decreasing number of items at each stage. This graphical display simplifies pinpointing obstacles and spaces that need enhancement. However, other charts, like bar charts or line charts, can supplement a funnel chart, providing additional insights into the data.
Can Excel do a funnel chart?
Yes, Excel can create funnel charts. It is more intuitive than some dedicated visualization tools. But, Excel offers flexibility and customization for creating funnel charts. It's a good choice if you already have your data in Excel and are comfortable with the software.
What is the difference between a waterfall chart and a funnel chart?
Waterfall and funnel charts display how value changes over time but serve different purposes. A funnel chart illustrates how something gets smaller at each process stage, similar to a funnel. It's really useful for tracking how many things happen or stop. A waterfall diagram is like a step-by-step recipe showing how a starting number transforms as it goes through a series of steps, ending up as a final number. It helps you understand how everything fits together to create the whole thing.
Conclusion
A funnel diagram is also good for showing processes. It helps to find areas to improve. While MindOnMap offers a basic approach, tools like Canva, Google Sheets, Excel, and Lucidchart provide more robust features, customization options, and data integration capabilities. The optimal choice depends on what you need specifically. Consider the data's complexity, customization level, and collaboration needs. Evaluating many options is essential. Before selecting the best tool for your funnel chart creation, you must do this.