Make A Funnel Chart on Google Sheets [Detailed Guide]
The funnel chart or funnel diagram is a visualization tool used to represent stages in a process. It can even visualize the flow of users or data through stages. Plus, it resembles a funnel since it is typically longer at the top and narrow at the bottom. There are various reasons why you need to create a funnel chart. It can be used to visualize data flow, identify inefficiencies, communicate insights, and more. So, we can tell that a funnel chart can play a big role in representing data. With that, if you are interested in learning about the best way to create an exceptional and creative funnel diagram, you can read this post. The full content of this discussion is all about how to make a funnel chart on Google Sheets. Begin reading and learn more.

- Part 1. Create a Funnel Chart in Google Sheets
- Part 2. Pros and Cons of Using Google Sheets to Make Funnel Chart
- Part 3. Best Alternative to Google Sheets for Creating Funnel Diagram
- Part 4. FAQs about Creating a Funnel Chart on Google Sheets
Part 1. Create a Funnel Chart in Google Sheets
Google Sheets is a cloud-based spreadsheet software you can use on Google. This tool can help you create and insert the data you want to represent. Also, this tool can assist you in creating an excellent Funnel chart. Well, the software can offer all the functions you need to achieve your preferred result after the chart-making procedure. Since you are creating a funnel chart, then the tool can offer the Stacked Bar Chart function. With this function, you can better visualize all the data you have in your column. What’s more, it has the Helper Column section that can help you get the final output. Another good thing here is that you can change the bar color. So, if you want to create a colorful funnel chart, you can do so. Therefore, we can tell that Google Sheets is among the best tools to create an amazing funnel diagram.
However, using Google Sheets has some disadvantages. The process of making a funnel chart is not that simple, especially for beginners. Well, the user interface is confusing, and the functions are hard to navigate. We recommend asking professionals for guidance when using the tool for making the diagram. Also, you can check the steps we have provided below to learn how to make a funnel chart in Google Sheets.
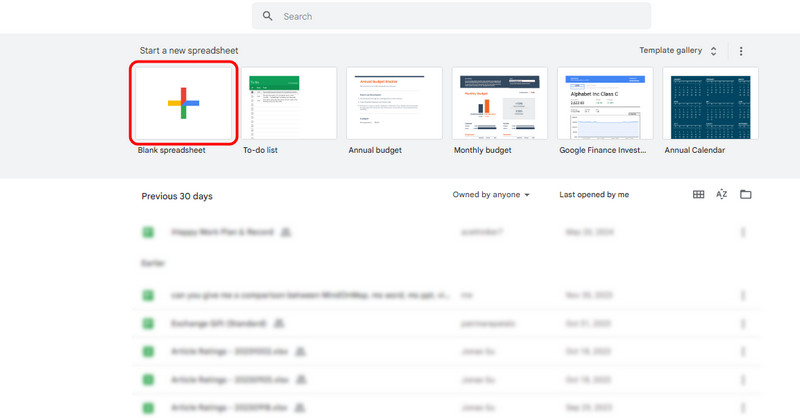
Go to the browser and open your Google account. You can create an account if you don’t have an account yet. After that, go to the Google Apps section and open the Google Sheets. Click the Blank Spreadsheets to begin the process.
Once you are on the tool’s main interface, you can begin inserting all the data you need for your chart.
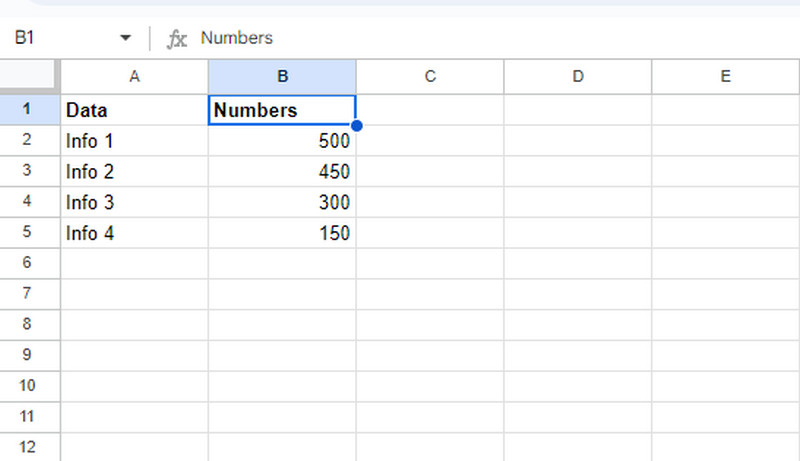
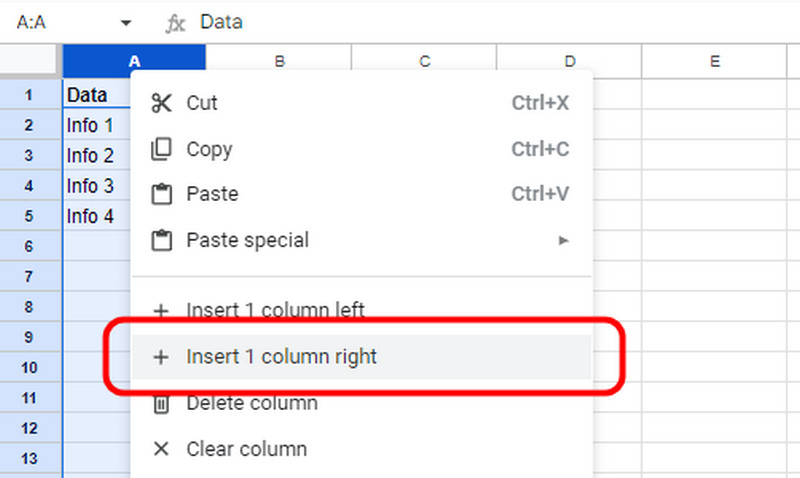
You can create a Helper Column by inserting another column to the left part. After that, insert this formula =(max($C$2:$C$5)-C2)/2 under the Helper column. It determines the maximum value of the data.
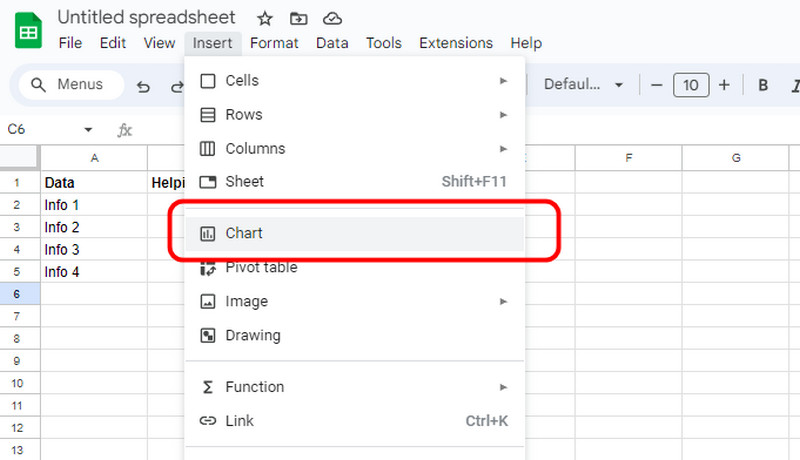
After that, go to the Insert > Chart section. Then, use the Stacked Bar Chart. After that, you will see the graph on your Google Sheets.
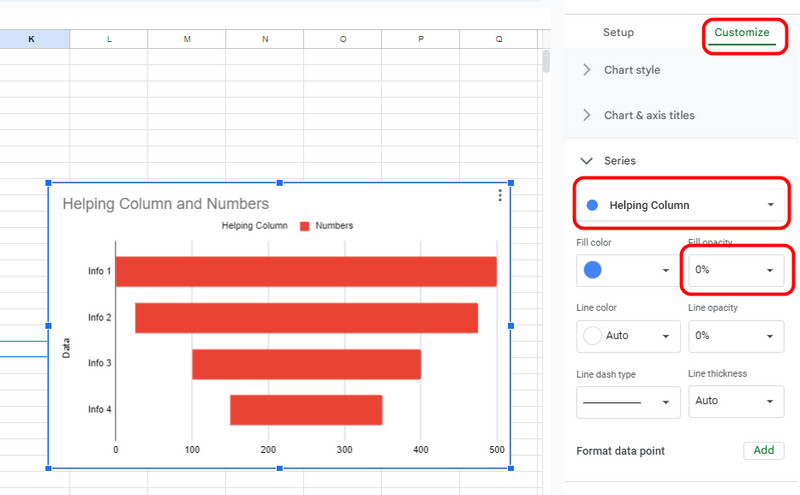
Now, you must edit the chart. Go to the Edit section and select the Series option under Customize. Then, go to the Helper Column action and turn its Opacity to 0%. With that, you can see your final funnel chart.
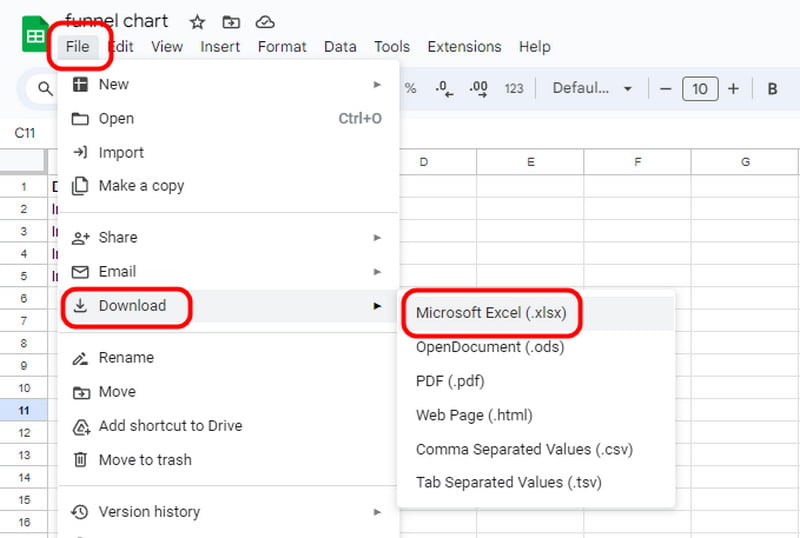
To save the funnel chart, go to the File > Download option. Then, you can begin downloading your file on your computer. And you also can make Org charts in Google Sheets.
Part 2. Pros and Cons of Use Google Sheets to Make Funnel Chart
If you want to know more about the pros and cons of using Google Sheets when creating a funnel chart, see the information below.
PROS
- The tool is free and accessible.
- It is good for collaboration purposes.
- -Google Sheets can integrate with other Google services.
CONS
- The chart-creation procedure is complicated since its functions are hard to locate.
- -The tool requires an internet connection to perform well.
- -Since the tool does not provide a funnel chart template, you must edit the stacked bar chart template.
My Experience
Well, after using the tool for creating the funnel chart, I can tell that it is enjoyable. I can make my chart very informative since I can visualize the data well. With that, I will recommend using this tool for creating a funnel chart. The only thing that I don’t like here is that the process is a little bit complicated. So, it would be best for some beginners to look for tutorials when creating the chart using Google Sheets.
Part 3. Best Alternative to Google Sheets for Creating Funnel Diagram
If you think Google Sheets is challenging to navigate in terms of creating a funnel chart, then use MindOnMap as your alternative. It is another online tool that can help you create the chart easily and instantly. Regarding the interface, we can tell that this one is more understandable and simpler to navigate. Plus, it can also offer various shapes, lines, and other elements you need. With that, MindOnMap is another reliable tool you can use to achieve your desired result. Aside from that. You can save the final chart in different formats, such as JPG, SVG, PNG, PDF, and more. You can also keep it on your MindOnMap account for long-term preservation. So, if you want to know how to create a funnel chart using this tool, check the tutorials below.
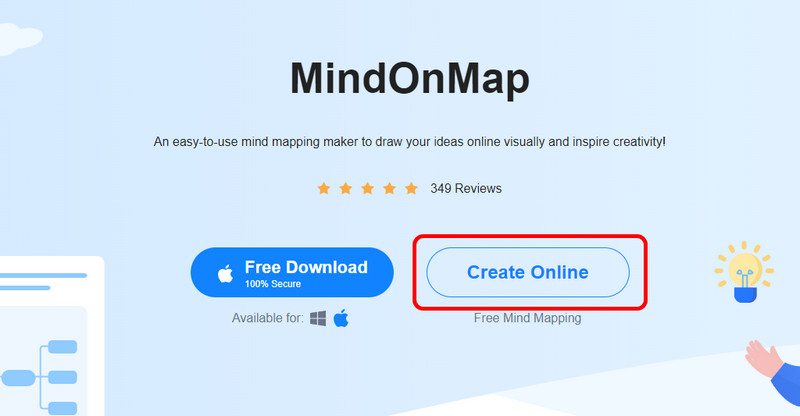
Access MindOnMap on your browser. Then, click Create Online to proceed to the next web page.
Secure Download
Secure Download
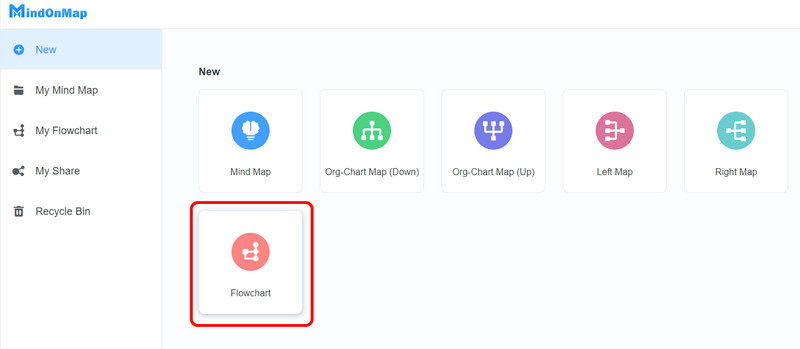
Then, go to the New section and click the Flowchart feature. Then, you can start creating the funnel diagram.
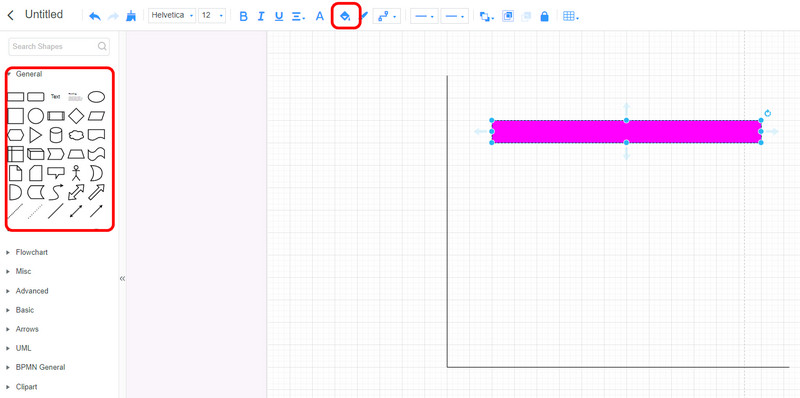
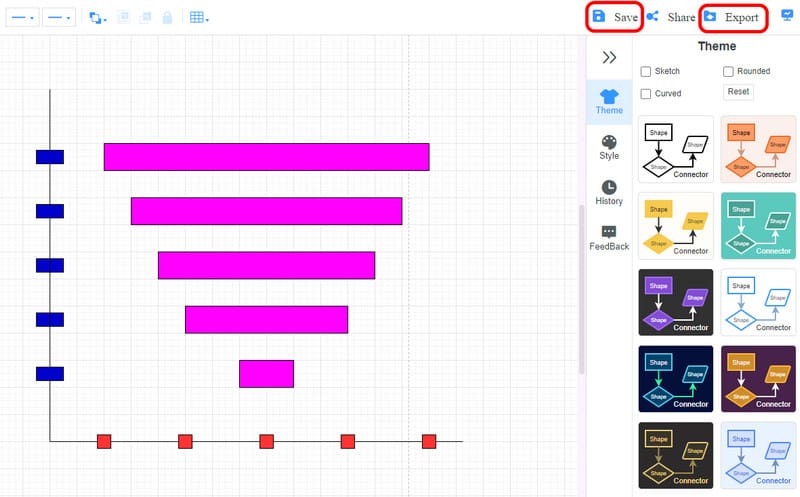
Go to the General section to use the shapes you need for the funnel chart. After that, you can add color to the shapes by using the Fill Color function from the top interface. Click the function and select your preferred color.
After you finish creating the funnel chart, you can save it by ticking the Save button. You can also click Export to save the funnel chart as a JPG, PNG, SVG, PDF, and more. What's more, MindOnMap is also a great Gantt chart maker.
Part 4. FAQs about Creating a Funnel Chart on Google Sheets
How do I make a Google chart in Google Sheets?
If you want to make a chart using Google Sheets, the first thing to do is to insert all the data you need on the spreadsheets. After that, navigate to the Insert section and choose the Chart option. After that, you can begin selecting your preferred chart.
How do you make a simple funnel?
If you want to make a simple funnel, you can use a simple tool like MindOnMap. From the main interface, use the various shapes you need from the General section. Then, you can add color using the Fill Color option from the top interface. After making the funnel, click the Save button to save the chart on your account.
Is there a Google Sheets funnel chart template?
-Unfortunately, the tool is unable to provide a funnel chart template. However, the most effective way is to edit the Stacked Bar Chart template. You can use this template to create a funnel chart effectively.
Conclusion
Visit this post if you want to know the best way to create a funnel chart on Google Sheets. This tool will ensure that you can get your final outcome without any trouble. Also, if you are looking for the best Google Sheets alternative, use MindOnMap. This tool is simpler to use and can provide all the functions you need to achieve the best funnel chart.