Value Stream Mapping Examples: Making an Incredible Lean Tool
Value Stream Mapping (VSM) is a potent lean management technique that aids companies in improving and visualizing their workflows. Maps that show how information and materials move through a company can help them find inefficiencies, simplify processes, and increase efficiency. Whether you work in software development, healthcare, or manufacturing, VSM offers insightful information on how value is provided to clients.
In connection with that, this post will lead you to the Value Stream Mappings examples and templates. Also, we will help you in creating successful value stream maps and provide real-world examples to highlight their significance. Understanding VSM will enable you to make well-informed decisions that improve efficiency, let us start that here.

- Part 1. Best Value Stream Mapping Creator
- Part 2. List of Common VSM Templates and Examples
- Part 3. FAQs about Value Stream Mapping Examples
Part 1. Best Value Stream Mapping Creator
MindOnMap's user-friendly design and robust capabilities make it a great option for Value Stream Mapping or VSM. This application makes it easier to visualize and analyze workflows, which facilitates the identification of inefficiencies and potential improvement areas. Important characteristics consist of:
• Drag-and-drop. This feature makes it simple to generate and edit value stream maps using the intuitive drag-and-drop interface.
• Customizable Templates. Create your own or select from pre-made templates to meet your needs.
• Real-Time Collaboration: Work concurrently with team members to make sure everyone agrees.
• Integrated Data Analysis: Use the tool's built-in analytics to examine process metrics and make data-driven choices.
• Smooth Export Options: You can easily share and integrate your maps into reports by exporting them in a variety of formats, such as PNG and PDF.
You can effectively map, evaluate, and enhance your value streams using MindOnMap, improving operational efficiency and producing superior business results. Let’s see how we can use it and prove the incredible features it has.
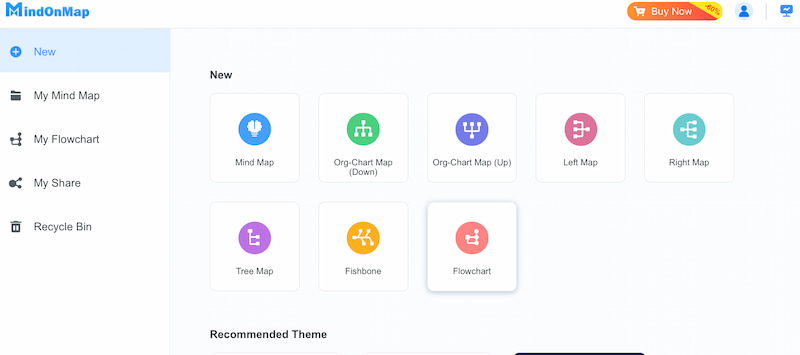
Open the tool of MindOnMap on your computer. Then access the button for New and click on Flowchart.
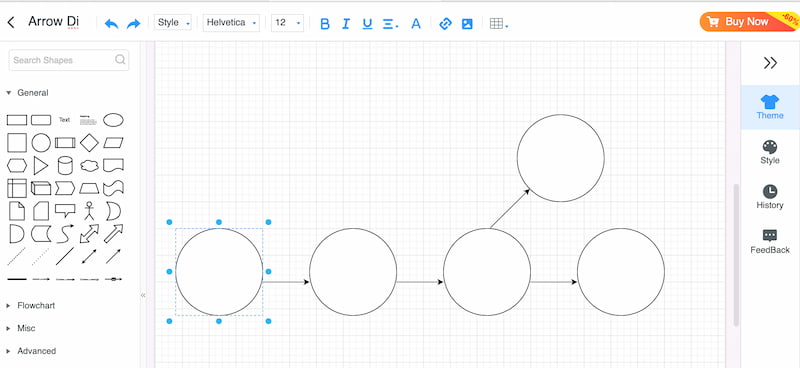
The tool will now lead you to its working space. Here, you can now use the wide variety of Shapes to build the Value Stream Map you need. You can add shapes as much as you want depending on the kind of map you are creating.
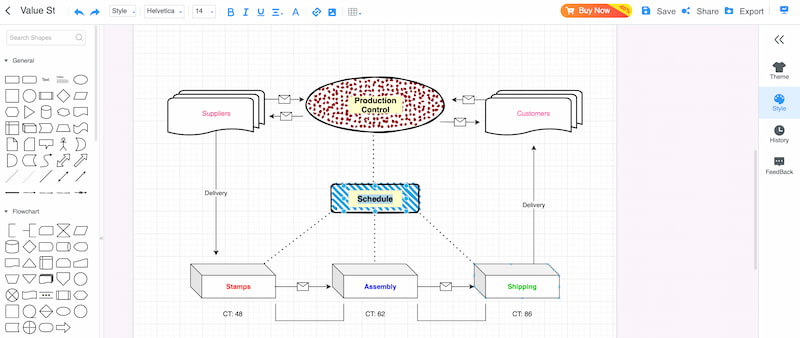
After placing all the shapes you need in the proper place, then it is time to label each shape via Text to add more details to the flowchart. Remember to add every detail so that there will be no issues when it comes to the presentation or reports.
Finally, we are now going to finalize the Value Stream Map by changing the themes and styles. From there, Save your map now.
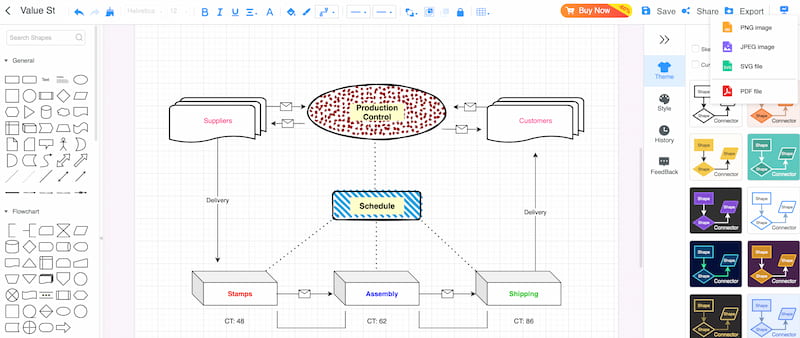
There you have it, an incredible MinOnMap Visual Stream Map. We can see with the use of the simple steps and incredible shapes of the tool we get to create a visually appealing Visual Stream Map. The process is instant, and the result is extravagan. No wonder why many people and experts are calling it the best Value Stream Mapping tool. What are you waiting for? Use MindOnMap now and get that Value Strem flowchart with ease.
Part 2. List of Common VSM Templates and Examples
Automated Value Stream Map Whiteboard
Want to eliminate uncertainty from the value stream mapping process and accurately identify areas for improvement? You can count on the Automated Value Stream Map Whiteboard Template to assist you! Similar to the preceding alternative, this value stream mapping analysis template is jam-packed with benefits that promote cooperation and teamwork. Brainstorming process bottlenecks are commonplace with features like real-time editing, note-taking, and connection to tasks and Docs.
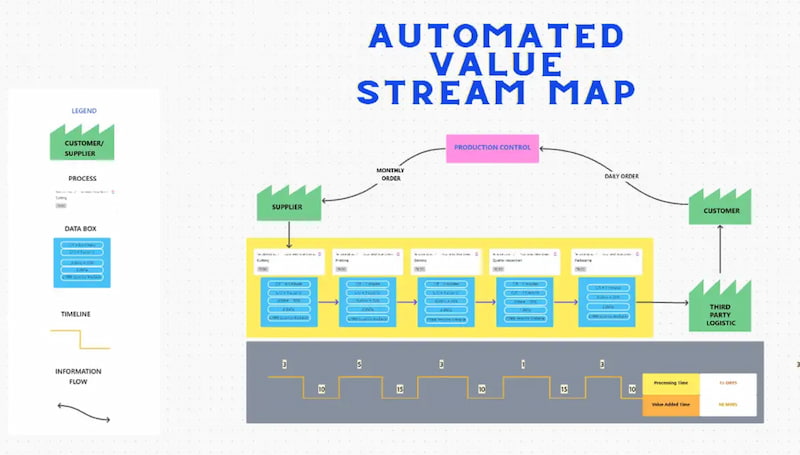
ClickUp Value Stream Mapping
With the ClickUp Value Stream Mapping Template, you can bring together members of various teams and use visual aids to obtain an objective perspective on workflows. This template is called a Whiteboard; see it as a digital canvas where you and your colleagues can collaborate to visualize and solve problems while exchanging viewpoints. To centralize work, ClickUp Whiteboards come with built-in capabilities for tying ideas to tasks, documents, and files.
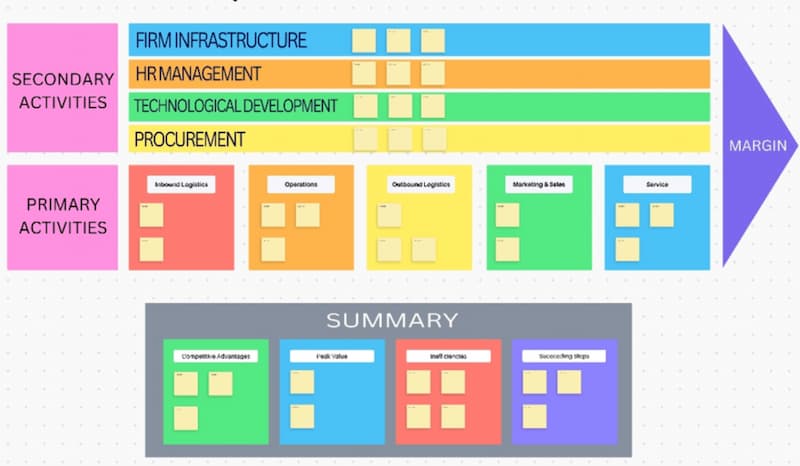
Value Chain Whiteboard
The succession of primary and supporting activities that add value to a product is represented by a value chain network. The Value Chain Whiteboard Template makes it possible to micro-analyze procedures such as purchasing, warehousing, human resources, and even after-sale support. The appropriately colored template offers a foundation for creating an extensive value chain. For Primary activities, use the square boxes, while for Secondary activities, use the rectangle tiles.
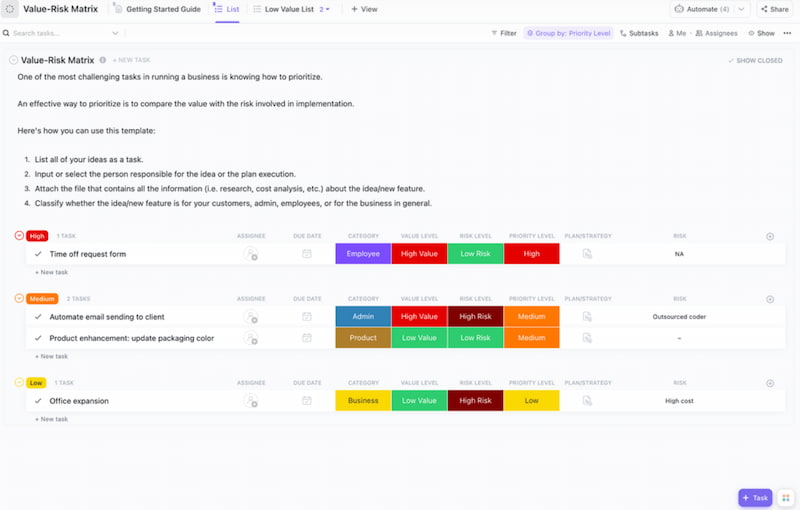
Risk Matrix Template
You should weigh the risks and potential added value when choosing whether to embark on a new project or make a big change in your business. Use the Risk Matrix Template to help you prioritize projects and activities that are high-value but relatively low-risk.
To establish the relationship between the value and complexity of production jobs, the template features a value risk matrix. To keep your high-risk and low-risk efforts organized, switch between the List and Board views.
Process Audit and Improvement
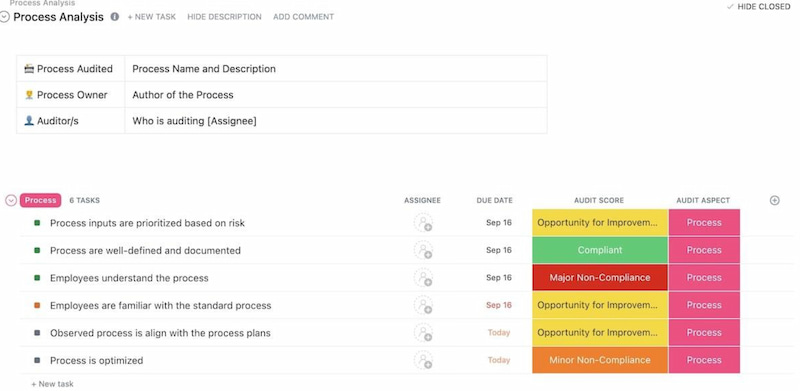
Workflows that were effective in the past may become antiquated as your company grows. Using the Process Audit and Improvement Template, you may begin conducting audits to reevaluate processes in terms of productivity and cost efficiency. With the aid of this tool, you may fairly evaluate your present procedures, identify flaws and redundancies that lower productivity or profitability, and implement corrective actions.
Process Mapping Template
The Process Mapping Template is your quick fix for lowering expenses, raising productivity, and decreasing waste. This template assists you in identifying and resolving bottlenecks by providing you with comprehensive insights into the relationships between the many steps that make up your processes.
This task template consists of 22 smaller tasks that make up a to-do list. Each one shows a process mapping objective and offers brief guidance on how to achieve it. For instance, the first subtask identifies the process that has to be improved, and the second subtask identifies the employees that are involved in the delivery.
Business Process Improvement Project Charter
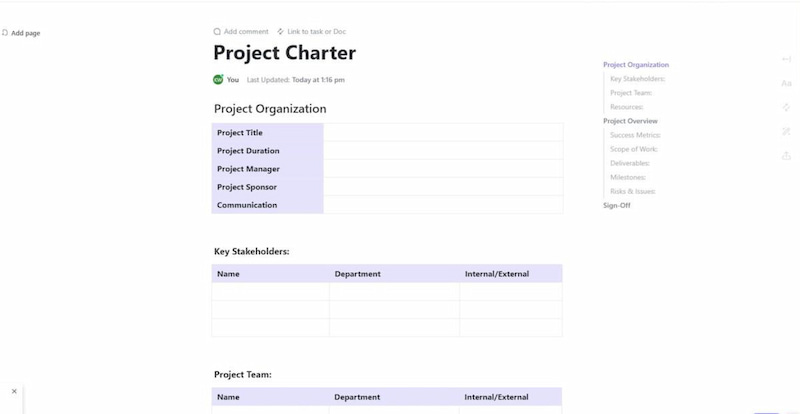
To keep ahead of the competition and develop customer success initiatives, project managers need to improve their processes continuously. You may design and implement improved workflows with an orderly document thanks to the Business Process Improvement Project Charter Template.
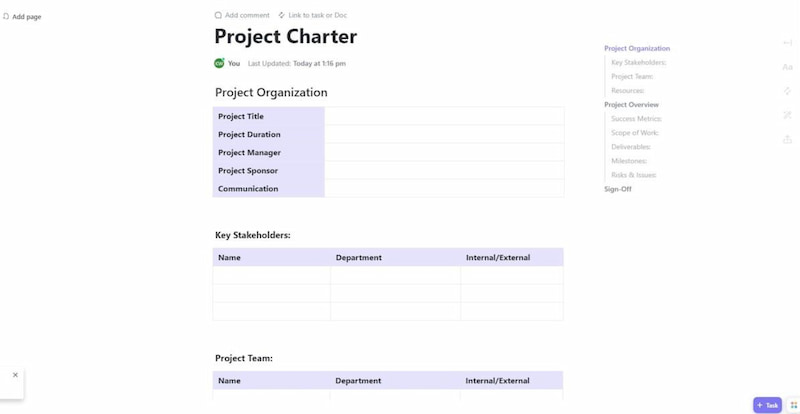
This template uses a simple tabular style. Provide information about the project, the organization, and the managers to begin a new endeavor. You receive tables specifically designed to help you define the roles and responsibilities of your project team and stakeholders.
Part 3. FAQs about Value Stream Mapping Examples
What is a real-life example of a value stream?
A consumer goods manufacturing company is one example of a value stream in the real world. The value stream starts with the procurement of raw materials, proceeds through the steps of production, including packing, quality assurance, and assembly, and concludes with the delivery of the completed product to the client.
How do you explain value stream mapping?
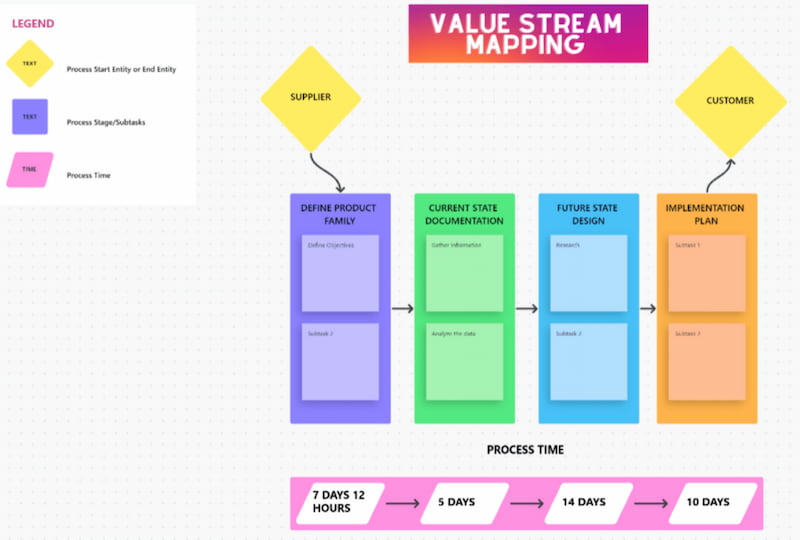
A lean management technique called value stream mapping (VSM) is used to show how information and materials move to deliver a good or service. It aids businesses in locating process bottlenecks, inefficiencies, and non-value-added tasks. With VSM, teams can map out the complete process from beginning to end and identify areas where waste can be cut.
How does VSM work step by step?
In VSM, the product must be identified, the workflow must be mapped, inefficiencies must be found, an improved process must be designed, an action plan must be made, and changes must be put into place while being closely monitored.
What does VSM aim to achieve?
Value stream mapping, sometimes referred to as lean process mapping or value stream analysis, is a technique for implementing process improvement through waste reduction and shorter process cycle times. One of the key components of Lean Six Sigma (LSS), a well-known method for process optimization, is VSM.
Which three tasks make up value stream mapping?
Value stream maps come in three varieties: ideal state, future state, and current state. The steps in the continuing value delivery process are described in the current status map. The ideal state map shows the ideal circumstances free from limitations and bottlenecks.
Conclusion
A business model's value stream is the set of procedures and actions it uses to enhance inputs and provide goods to clients. Value stream mapping templates and examples let you quickly and easily generate a map that shows possible areas for material and labor waste reduction. More than that, MinddOnMap is here to help us create flowcharts that are much easier and better quality, such as VSM charts. Remember, a lean tool called a value stream map aids in making the most of the company's resources and guarantees that time and materials are used effectively. Therefore, use MindOnMap to make it efficient and effective.


